PPC managers understand that Quality Score is an important metric as it strongly correlates with the success of Google ads and/or Bing ads accounts. So, the higher the Quality Score the better performance you can expect.
With that in mind, I wanted to dive deeper into the importance of Google's Quality Score and share 5 actionable tips on tracking the development of your Quality Score.
Click on one of the links below to go straight to the specific section:
- What Quality Score consists of
- What the benefits of a high Quality Score are
- How to track the development of your Quality Score
What does Quality Score consist of?
Quality Score consists of:
- Ad relevance (Below average, average, above average)
- Landing page experience (Below average, average, above average)
- Expected click-through rate (Below average, average, above average)
Nobody really knows which metric Google weighs more for Quality Score. It might be that all 3 metrics are evenly weighed. However, there are speculations in the industry that expected click-through rate weighs the most for one simple reason – the more clicks Google gets, the more they earn.
A very important note: Quality Score and its components are at keyword level.
What is ad relevance?
Ad relevance is exactly what you would expect – how relevant the ad is for a certain search query.
Here is an example: If you are searching for Red Snowing Gloves and the ad is about Red Snowing Shoes you can guess that the ad relevance will be lower than for the ad that is about Red Snowing Gloves.
This is the reason why so many PPC managers use the SKAG (single keyword ad group) structure. This way you can tailor ads to a specific keyword so that your ad relevance, and hence quality score, improves. Of course there are many more structures to try and each of them have pros and cons as I explained in a recent post I did on LinkedIn.
What is ‘landing page experience’?
In short, landing page experience measures how well your landing page works and how relevant it is to what a user searched for. According to Google, there are 5 main things that influence landing page experience scores:
- Relevant, useful, and original content
- Transparency and trustworthiness
- Easy navigation on all devices
- Low landing page loading time
- Site speed
It is not stated which point is the most important, but from personal experience, I have to say that you should focus on relevancy and speed.
If you want to go all-in you could make a separate landing page for each search query, but I recommend focusing on vertical/category.
For example, I work for a website builder company and I would have a separate landing page for “website” keywords and a separate one for “blog” keywords.
For site speed you either work on your site or you can use landing page builders like Unbounce that have awesome site speeds.
What is ‘expected click-through rate’?
Expected click-through rate is not the same as your click-through rate. Google compares your keyword click-through rate to other keywords on your account, as well as other search result click-through rates on the SERP. This means if your click-through rate is lower than the average on the SERP then you will have a lower expected click-through rate score.
What are the benefits of a high Quality Score?
I will generalize, but roughly there are 2 main things that influence your ad show rate and position – your max CPC bid and your Quality Score. Quality Score has a very big influence because Google’s main focus is to show the most relevant results first. So accounts with poor quality can’t buy their way to the top.
This means that, generally speaking, you actually save money by having a higher Quality Score. Not only that, there are strong correlations that the higher your Quality Score, the cheaper your cost per conversion will be.
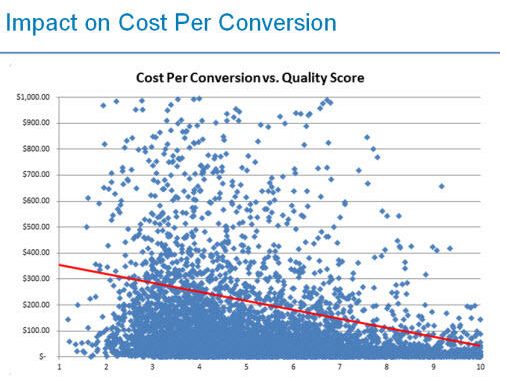 source: Wordstream
How do you track the development of Quality Score?
We all now see which components we need to improve to have a higher Quality Score. However, Google doesn’t show you the development of your Quality Score or its components. You also can’t see them aggregated on the ad group, campaign, or account level.
But luckily with some Excel manipulations and calculations, there is an easy way to track the progress you're making with the Quality Score.
We will weigh the Quality score, eCTR, landing page experience and ad relevance to see the aggregated Quality Score and its development over time. You can weigh against impressions, clicks or cost. I tend to do it against cost.
Here is an example why the weighted tactic is necessary:
If you had 1000 impressions, 100 clicks and a CTR of 10% for one keyword and 100 impressions, 1 click and a CTR of 1% for another – your average CTR wouldn’t be 5,5%. It would be 9%.
The same goes for Quality Score. If you are spending 100 USD on a keyword that has a quality score of 10 and 10 USD on a keyword that has a quality score of 2, it doesn’t mean that you have an average quality score of 6.
How to track the development of your Quality Score step-by-step:
1. Create a keyword report and download it in Excel
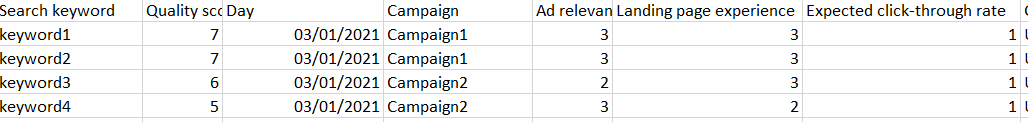
Add Campaign; Search keyword; Day; Quality score; Ad relevance; Landing page experience; Expected click-through rate; Impressions; Clicks; Cost. Set the date to yesterday.
You will have to download this report every single day. (You can also do it less frequently, but it depends how you want to evaluate it).
2. Replace ‘below average’ with 1, ‘above average’ with 3 and ‘average’ with 2 for ad relevance, landing page experience and eCTR.
You should get something like this:
3. Create extra columns for weighed formula calculations
Now that we have numerical scores for our components of the Quality Score, we can do the calculations.
You have to create extra columns for Weighed Quality Score, Weighed Landing Page Experience, Weighed Ad Relevance and Weighed Expected Click-through rate.
As I said, I use cost for these calculations, but you can use clicks or impressions.
The formulas are simple:
- Ad relevance x Cost
- Expected clickthrough rate x Cost
- Landing page experience x Cost
- Quality score x Cost
You should get something like this:
4. Save this as an original file
This will be your original file which you will populate with next days data to track development. Your file will look something like this:

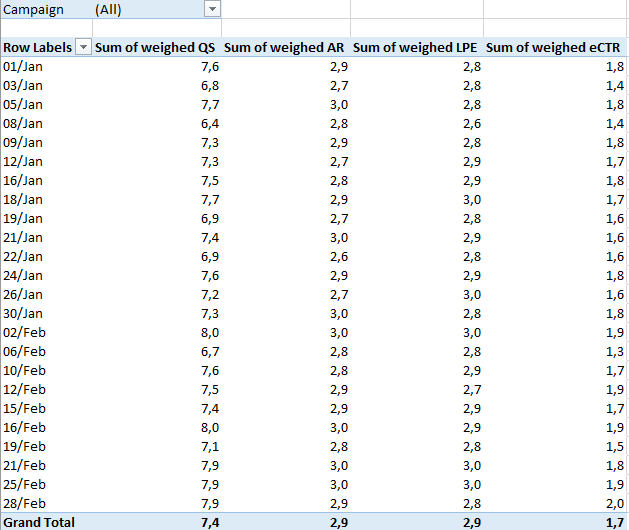
5. Create a pivot table and graphs
Now that we have more days on the spreadsheet we can create pivot tables and graphs to see the development. This shows you what your quality score is on a daily level and how its components are performing.
You could get something like this:
And for better illustrations you can create a graph from this pivot table:
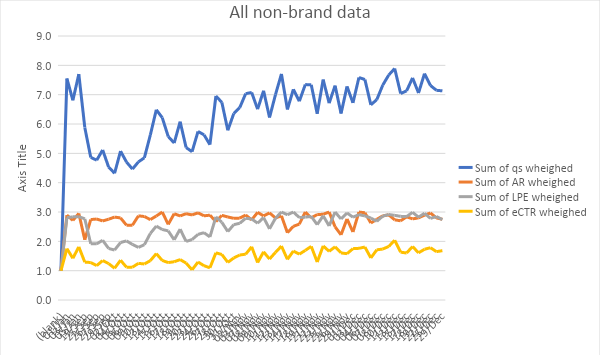
This helps a lot in identifying which component you need to work on. As you can see I did a good job on improving Quality Score by improving landing page experience and expected clickthrough rate.
Also, if your average Quality Score is low, it means you are spending quite a lot on keywords that need attention. Perhaps you have to pause/exclude some keywords all together or look into the search terms to see if you are not triggering something completely irrelevant.
In conclusion, is it worth it?
If you are serious about improving your Quality Score this is a must. Without this I wouldn’t have known if my changes on the landing page are improving landing page experience and Quality Score.
It is fine if you don’t do this daily, but you could try to download the report every 2-3 days to make a nice trend line. I hope this inspires you to work harder on improving your Quality Score!