When potential customers leave items in their cart without completing the purchase, it represents a missed opportunity for revenue generation.
To tackle this challenge head-on, leveraging the power of analytics is essential. In particular, Google Analytics 4 presents a robust solution for tracking and analyzing cart abandonment. In this article, we will dive into how to track shopping cart abandonment step-by-step using Google Analytics 4.
Let's unlock the power of data to drive success for your online store.
- About 70% of online shoppers abandon their shopping carts, highlighting the significance of addressing cart abandonment as a concern for online store owners.
- Google Analytics 4 is a powerful tool that can be used to track and analyze cart abandonment, providing valuable insights into buyer behavior and the effectiveness of the checkout process.
- You can track cart abandonment by creating four steps in the funnel in GA4: "view_item," "add_to_cart," "begin_checkout," and "purchase.
What is shopping cart abandonment?
Shopping cart abandonment occurs when your potential customer adds items to their online shopping cart but leaves the website or app without completing the purchase. It is a common phenomenon in eCommerce and can have a significant impact on a business's sales and revenue.
ECommerce businesses often employ strategies such as retargeting ads, personalized emails, and simplifying the checkout process to reduce shopping cart abandonment rates and encourage customers to complete their purchases.
Cart abandonments statistics
According to data from the Baymard Institute, the average cart abandonment rate stands at 69.99%, based on 48 comprehensive studies ranging from 56% to 81%. This means that only about three out of every ten customers who add items to their carts actually proceed to complete their purchase.
But the rate of cart abandonment differs depending on the type of device used for shopping. Desktops witness a cart abandonment rate of 73%. Despite offering a comfortable viewing experience with larger screens, desktops still face significant abandonment.
Tablets, on the other hand, see a higher cart abandonment rate of 80.74%. While shopping on smaller screens, users tend to abandon their carts more frequently. Mobile devices have the highest cart abandonment rate among all devices, standing at a staggering 85.65%.
Why do shoppers abandon carts?
There are various reasons why customers abandon their shopping carts, including unexpected shipping costs, complicated checkout processes, lack of trust in the website or concerns about payment security.
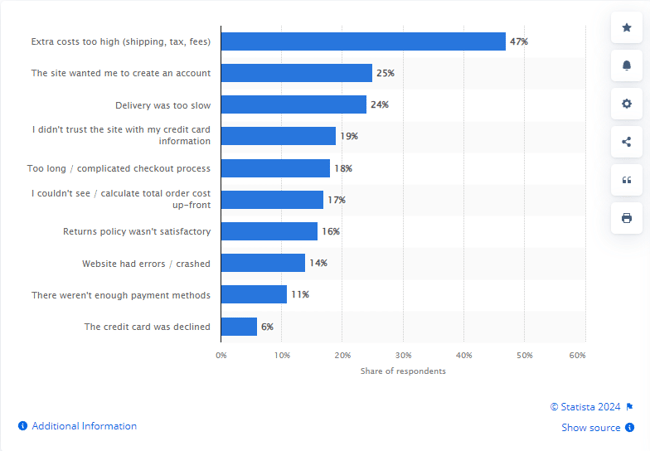
Source: Statista
High costs: Additional fees such as taxes, shipping, or other charges that were not initially displayed can deter customers from completing their purchase.
Mandatory account creation: Requiring shoppers to create an account before checking out can be off-putting and time-consuming. Some customers prefer a quicker and more streamlined process.
Delivery too slow: not acceptable delivery options.
"Window shopping": Sometimes, customers add items to their cart without actually intending to make a purchase. They may simply be browsing or comparing prices.
Limited payment options: If a website doesn't offer the preferred payment methods of customers, they may choose to abandon their cart rather than go through the hassle of finding an alternative payment option.
Website issues: Technical problems, slow loading times, or a confusing interface can frustrate shoppers and cause them to abandon their carts.
This is how cart abandonment impacts your online store
Imagine walking into a convenience store, adding all the items you need to your shopping cart, and then leaving the store without making a purchase. This real-world scenario perfectly illustrates the concept of cart abandonment.
On average, the conversion rate in the eCommerce industry is less than 5%. This means that out of every 1000 visitors to your store, only a maximum of 50 will actually complete a purchase. The remaining 950 visitors consist of those who simply browse without taking any action.
Such a high cart abandonment rate means a significant amount of potential revenue lost, as well as decreased customer lifetime value (loss of customer loyalty) and increased customer acquisition costs (it may require additional marketing efforts and expenses to attract new customers).
However, there are ways to bring these users back and boost revenue!

Abandoned cart vs abandoned checkout
When it comes to eCommerce, the terms "abandoned cart" and "abandoned checkout" are often used interchangeably. However, there is a subtle difference between the two.
An abandoned cart refers to a situation where a customer adds items to their shopping cart but leaves the website before completing the purchase. This can happen at any stage during the browsing and selection process.
On the other hand, an abandoned checkout specifically refers to the situation when a customer reaches the checkout page but fails to finalize the transaction.
While both scenarios mean lost sales potential, targeting strategies and optimizing the user experience can differ depending on whether the problem lies in the shopping cart or checkout stage.
Why is it important to track cart abandonment?
Tracking cart abandonment is crucial for several reasons.
Insights in buyer behavior
Tracking cart abandonment provides you with valuable insights into the user experience and potential pain points within the purchasing process. By understanding why customers abandon their carts, you can make necessary improvements to increase conversions and optimize your sales funnel.
Sales funnel optimization
Tracking cart abandonment helps identify trends and patterns. It allows you to analyze data such as device usage, traffic sources, product categories, and more. This information can be used to tailor marketing strategies, improve website design, and refine the overall customer experience.
Identifying checkout process issues
A significant cart abandonment rate could be attributed to errors or issues within your checkout process, such as a malfunctioning payment option. By examining and resolving these issues, you can improve the overall checkout experience and potentially reduce cart abandonment.
Evaluating the impact of website changes
If you have recently implemented changes to your website, such as introducing a new checkout page design, monitoring the cart abandonment rate can serve as a valuable metric to measure the effectiveness of these changes.By analyzing the correlation between changes made and the subsequent cart abandonment rate, you can make data-driven decisions to optimize your online store.
Possibility to implement successful targeting
Cart abandonment tracking allows businesses to implement targeted remarketing campaigns. By identifying users who have abandoned their carts, businesses can send personalized reminders, incentives, or offers to encourage them to complete their purchase. This helps to recover potentially lost revenue and increase customer retention.
How to calculate cart abandonment rate?
To gain insights into how your store is performing compared to industry benchmarks, it's essential to evaluate your cart abandonment rates.
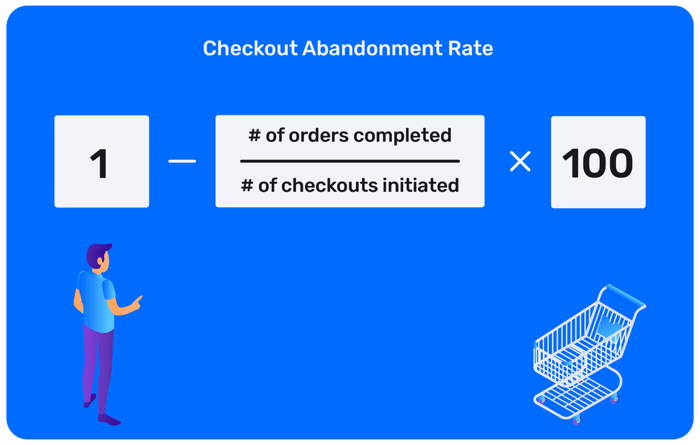
Calculating the cart abandonment rate is a straightforward process that provides valuable insights into the performance of your eCommerce store. By using a simple formula: dividing the number of completed purchases by the total number of people who added items to their cart, you can calculate the abandonment rate (the percentage of shoppers who did not complete their transactions). The formula is as follows:
Cart Abandonment Rate = (1 – (Number of completed transactions / Number of add to carts)) * 100
Example:
- Your eCommerce store had 3,000 completed sales in the last month.
- There were 30,000 initiated shopping carts that did not result in a purchase.
(1 – (3000 ÷ 30,000)) * 100 = 90%
The result: 90% of shoppers did not complete their transactions
While manual calculation of the rate can be time-consuming, setting up Google Analytics or utilizing appropriate tools can automate this process, allowing for easy access to this valuable data.
Source: ThinkShop by Bolt
Use Google Analytics 4 to track cart abandonment
Google Analytics is a valuable tool that enables you to collect data starting from the moment a user clicks on a search result until they exit your website. This data can be leveraged to monitor website traffic and visitor behavior.
Through the creation of funnels, you can efficiently focus on enhancing the customer journey by identifying specific areas of concern during the checkout process.
Let’s see how to find cart abandonment in Google Analytics 4!
1. Log in to Google Analytics 4
Access your Google Analytics 4 account and:
- Navigate to the Explorations Tab.
- Click on the option to create a new exploration.
- Give your new exploration a name, for example “eCommerce Funnel”.
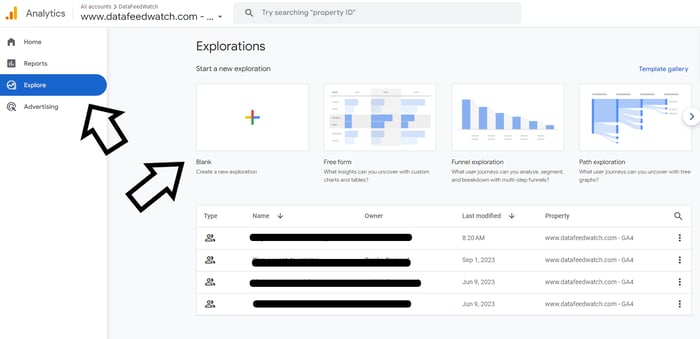
Explorations tab | Google Analytics 4
2. Set up the funnel exploration option
In the Technique section, you will find an option called Funnel exploration.
- Select Funnel exploration under Technique
This exploration technique allows you to analyze and visualize the progression of user actions through your website or app.
By selecting the Funnel exploration option, you can gain valuable insights into how users navigate through different stages of their journey, helping you identify potential areas for improvement.
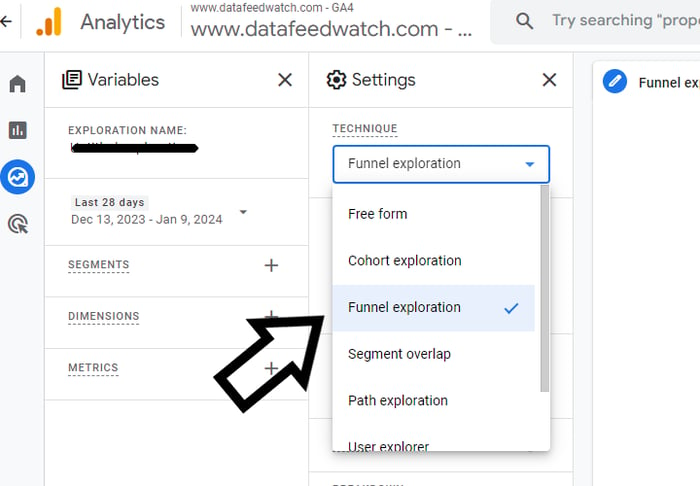
Funnel exploration | Google Analytics 4
Now it is time to start building the funnel analysis. To do this:
- Locate the pencil icon next to the STEPS section and click on it.
This action will allow you to define and customize the specific steps or stages that you want to include in your funnel analysis.
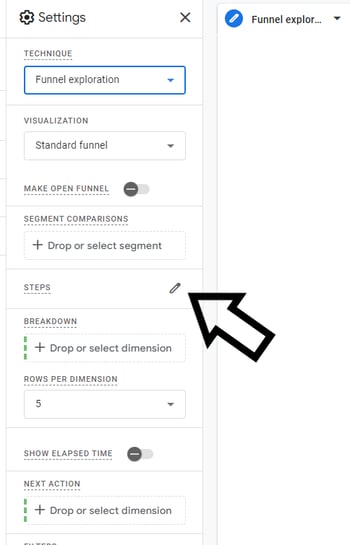
4 steps to track cart abandonment | Google Analytics 4
3. Create 4 steps of the funnel
To proceed, you need to create four steps for your analysis. You can find these steps under the Events section when you choose to add a new condition. It is important to provide meaningful names for each step to ensure clarity in the analysis.
- Step 1: Choose the view_item event and provide it with an appropriate name.
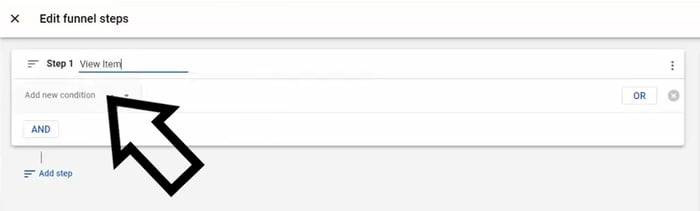
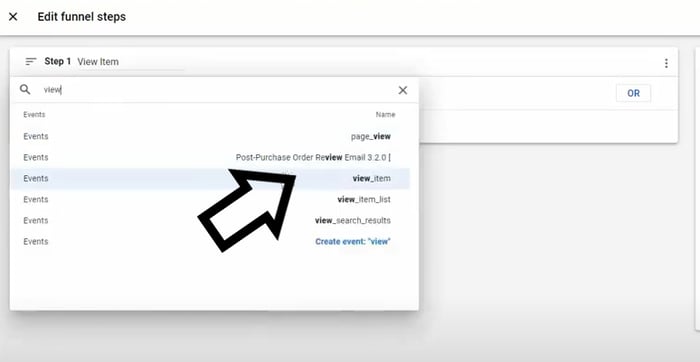
View item | Google Analytics 4
- Step 2: Select the add_to_cart event.
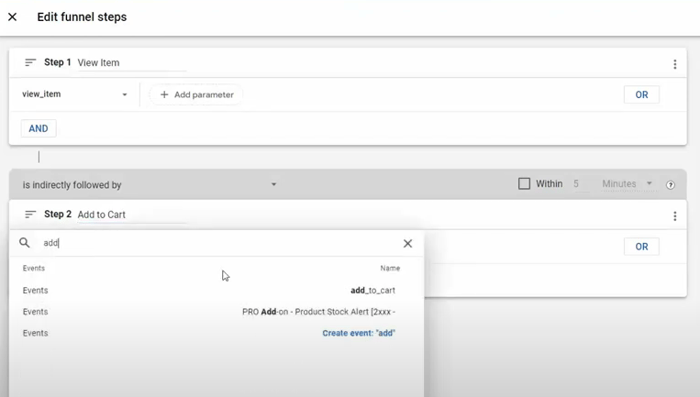
Add to cart | Google Analytics 4
- Step 3: Choose the begin_checkout event.
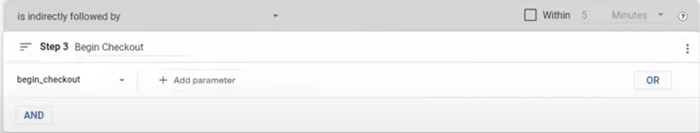
Begin checkout | Google Analytics 4
- Step 4: Select the purchase event.
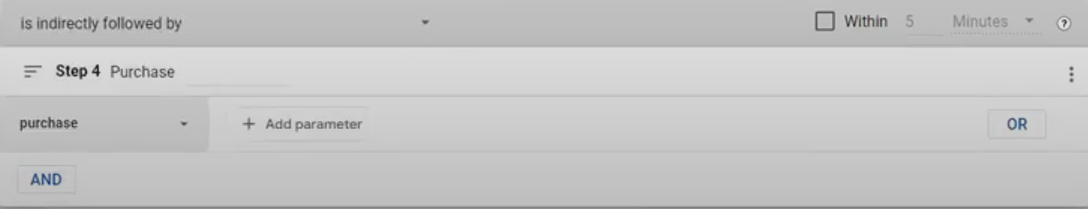
Purchase | Google Analytics 4
Remember to assign names to these steps that correspond to the events or convey their purpose effectively to make the analysis easier to understand and interpret based on your specific needs.
Once you have finished completing all the steps, locate the Apply button at the upper right corner of the screen.
- Click on the Apply button to save and implement your changes.
4. Get the cart abandonment insights
Once you've completed the previous steps, you will have the ability to assess the percentage at which users abandon both the Cart and Check out process. This allows you to analyze and understand the rate at which users leave without completing their purchase or checkout.
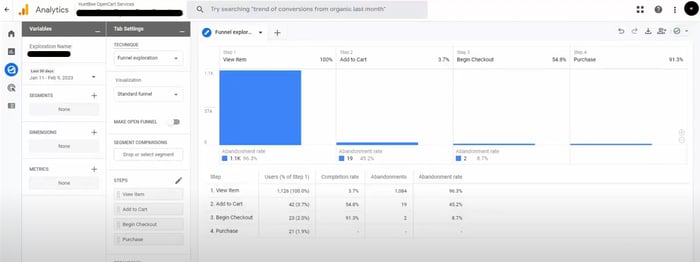
Cart abandonment analytics | Google Analytics 4
In the given scenario, the data shows that 96.3% of users leave the site after viewing an item without proceeding further. Additionally, 45.2% of users abandon their journey after adding items to their cart. Following that, 8.7% of users abandon the process after beginning the checkout. Finally, only approximately 3.7% of viewed items result in a successful purchase.
What report indicates the last page users viewed before leaving a website?
In Google Analytics 4 you can quickly generate the report that indicates the last page users viewed before leaving a website by using Exits metric. This report will provide insights into the specific pages where users tend to exit a website, allowing you to analyze user behavior and reduce cart abandonment in the long run.
To determine these pages using Google Analytics 4, you can follow a simple step-by-step process.
- First, access the Exploration tab and choose the Blank exploration option.
- Then, click on the "+" symbol next to DIMENSIONS and select Page path and screen class from the Page/screen category. Import this dimension to proceed.
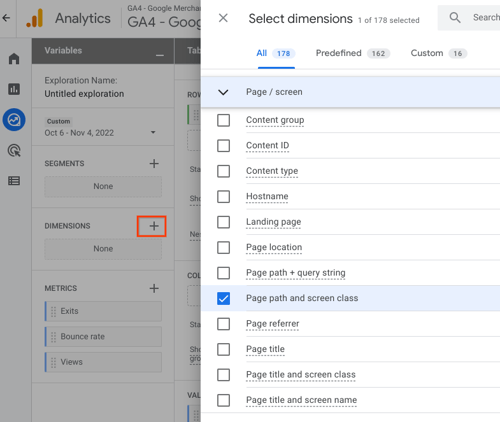
Generating Exits report step 1 | Google Analytics 4 (Google Support)
- Next, click on the "+" symbol next to METRICS and select Exits. You can also choose Views, and Bounce Rate to gain a wider perspective. Import these metrics to include them in your report.
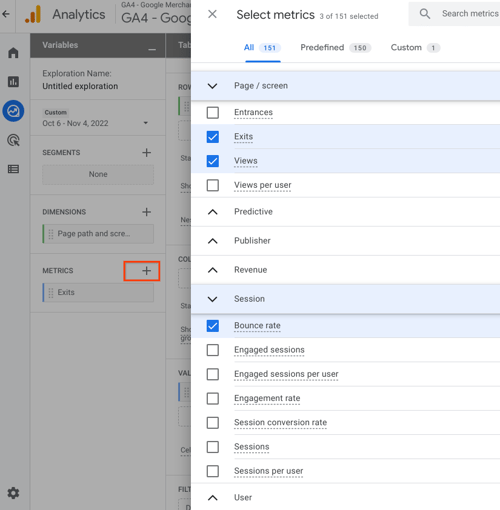
Generating Exits report step 2 | Google Analytics 4 (Google Support)
- Now, drag the Page path and screen class dimension into the ROWS area and then place the desired metrics into the VALUES area.
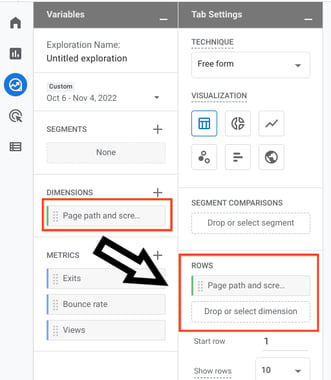
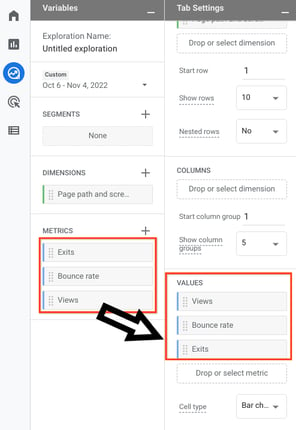
Generating Exits report step 3 | Google Analytics 4 (Google Support)
- Finally, organize and sort the exploration according to your preferred metric.
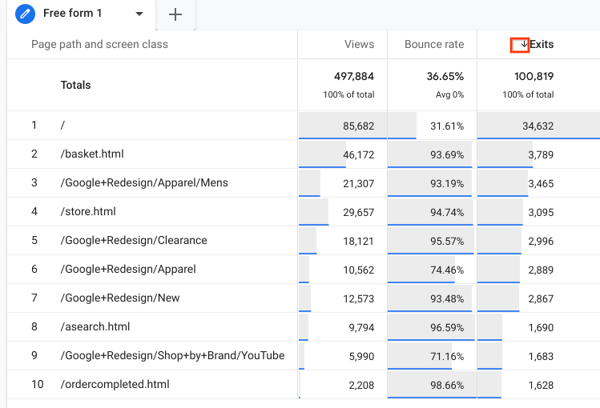
Generating Exits report step 4 | Google Analytics 4 (Google Support)
By following these steps and generating the report, you'll be able to identify the specific pages where users tend to exit your website.
How to get more out of your cart?
To get more out of your shopping cart and reduce cart abandonment, here are some effective strategies:
Offer multiple payment options: One common reason for cart abandonment is the lack of convenient payment methods. By providing a variety of options such as credit cards, digital wallets, and alternative payment methods, you can adjust to different customer preferences.
Utilize retargeting ads: Implement retargeting campaigns to reach out to customers who have abandoned their carts. These ads give shoppers a reminder and a friendly call to action, encouraging them to complete their purchase.
Offer free shipping: Providing free shipping is an effective method to reduce cart abandonment. Many customers consider high shipping costs as a deterrent, so by offering free shipping, you can incentivize them to proceed with their purchase.
Establish trust in the checkout process: Display trust badges, security seals, and customer testimonials to build trust and credibility. Research shows that customers are more likely to complete their purchase on sites they perceive as secure.
Optimize the checkout process: Simplify and streamline the checkout process to minimize friction and reduce the number of steps required. Short forms, guest checkout options, and progress indicators can help improve the user experience.
Conclusion
Tracking shopping cart abandonment in Google Analytics 4 is an important aspect of optimizing your eCommerce business. By understanding the reasons behind cart abandonment and identifying areas for improvement, you can enhance the checkout process and drive higher conversion rates.
We'd love it if you share your experiences of monitoring how often your customers abandon their shopping carts in the comments section below. Let’s improve our online selling efforts together.