My name is John Horn and I'm a partner at StubGroup Advertising. I've worked with hundreds of companies in the US and globally, from one-man shops to multinational corporations, and I've learned one key thing: You’re probably wasting money on Google Ads.
I’ve seen a tree service shelling out cash to reach people searching “Dollar Tree.” I’ve seen an ecommerce website accidentally double-counting the orders Google Ads was driving them. I’ve seen a car dealer rack up 23,000,000 worthless impressions from game and flashlight apps.
After personally auditing hundreds of Google Ads accounts over the years, I feel like I’ve seen it all. And then I’ll review a new account and get a fresh adrenaline jolt when I discover some new way an advertiser’s money is being wasted or huge potential value is being left on the table.
Wasting money and missing growth opportunities happens all the time in Google Ads accounts large and small, whether those accounts are self-managed or outsourced to the biggest agencies in the world. That’s why it’s critical for you or someone you trust to regularly audit your Google Ads account and catch those seemingly inescapable mistakes early.
With that in mind, here are five of the top things to look for during any Google Ads audit.
1. Look at Your Search Terms Report
2. Check Your Conversion Tracking
3. Use Google’s Ad Preview & Diagnosis Tool
4. Find Out How Much Traffic You’re Missing
5. Look at Your Data Per Device
BONUS: Free Google Ads Evaluation
1. Look at Your Search Terms Report
Keywords are the words and phrases you tell Google to target with your ads.

Search terms are the ACTUAL words people type or speak into Google when they trigger your ads.
Your search terms report is the beating heart of Search and Shopping campaigns.
Here are some red flags to look for in your search terms report:
1. Look for irrelevant search terms that are wasting your money.
If you clean septic systems and you see “clean septic wounds” in your search terms report, you now have a great new negative keyword to add. You can add the word “wounds” as a negative keyword, and this will prevent anyone who includes the word “wounds” in their search from triggering your ad.
2. Look for search terms with many clicks and few conversions.
Sometimes your traffic is relevant but you’re not showing people the right ads or sending them to the right section/page of your website.
If you see high-volume search terms with below-average conversion rates, take that as your cue to double-check which ad groups those search terms are triggering, and the ads and landing pages in those ad groups.
2. Check Your Conversion Tracking
If search terms are your account’s heartbeat, then conversion tracking is its pulse.
You can’t know how to generate more revenue and profit from your campaigns unless you know what is working well and what isn’t (and why or why not). Conversion tracking answers that question.
I’ve seen more ways to mess up conversion tracking than a Texas summer has days (which is around 365, by the way).
Here are some things to look for in your conversion reports:
1. Make sure you’re tracking conversions.
If you’re not, start doing so now.
2. Look for multiple conversion actions tracking the same thing.
One common mistake is to import Goals from Google Analytics into your Google Ads account and also track the same thing using Google Ads conversion tracking code.
Look at the pages on which your different conversion codes are firing, and see if any of them are the same.
To see the page your tracking code is firing on, go to the Conversions page in your Google Ads account, click on the name of the conversion action, and click “WEBPAGES.”
 If you see more than one conversion action firing on the same page, then you probably have a problem.
3. Check your conversion repeat rate
Having multiple conversion actions tracking the same thing isn’t the only way to accidentally overcount conversions.
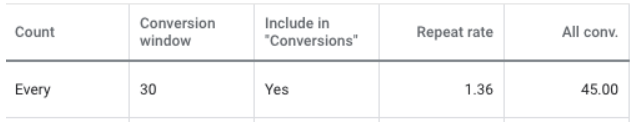
Every conversion action in your Google Ads account has a “Repeat rate.” You can find it on the Conversions page in your account.
If your repeat rate is higher than 1, that means that you’re sometimes counting more than 1 conversion for the same click. That’s okay in some scenarios. For example, if you’re an ecommerce website and some people place multiple orders, it’s good that you’re tracking every order.
But if you look at the “Webpages” tab and you see that the same order ID is being tracked as 14 different conversions, that’s a problem.
4. Re-evaluate what you are tracking as a conversion
You should only track something as a conversion if it is an action that has clear value for you. Form submissions, orders, phone calls — those can all be valuable. Tracking every time someone loads your home page is not.
3. Use Google’s Ad Preview & Diagnosis Tool
If you’re constantly Googling your keywords to see if your ad is showing up, please stop. There are a host of reasons why that’s bad, but it’s also unnecessary. You can use Ad Preview to see if your ad is appearing, what it looks like, what competitors’ ads look like, and which of your keywords are being triggered by specific search terms.
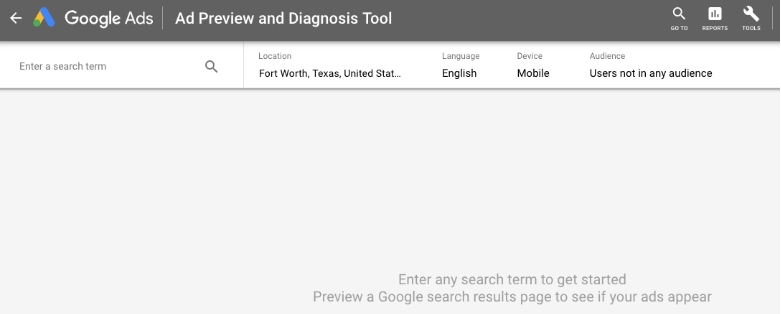
1. Type in search terms to see if they are triggering your ads.
If the search terms aren’t triggering your ads, Google will usually give you more info explaining why that is.
2. See if your search terms are triggering the RIGHT ads.
You may be using very specific ads that send people to relevant landing pages that are perfect for what those people are looking for. But, if your campaigns are structured improperly, people typing in those specific words may be triggering broader keywords in your account that show them less relevant ads, and take them to less relevant landing pages.
3. Keep an eye on your competitors’ ads.
Ad Preview is a great place to keep tabs on what your competitors are saying in their ads.
If you see your click-through-rate dropping, maybe that’s because the guy across the street is offering a 20% off coupon in his ads. You can watch for this kind of thing in Ad Preview.
4. Find Out How Much Traffic You’re Missing
Use Impression Share metrics to find out how often your ads are showing up vs. how often they should be showing up.
Per Google’s definition: “Search impression share is the impressions you’ve received on the Search Network divided by the estimated number of impressions you were eligible to receive.”
If you have 100% Impression Share, that means that your ads are appearing 100% of the time that someone’s search matched your targeting criteria.
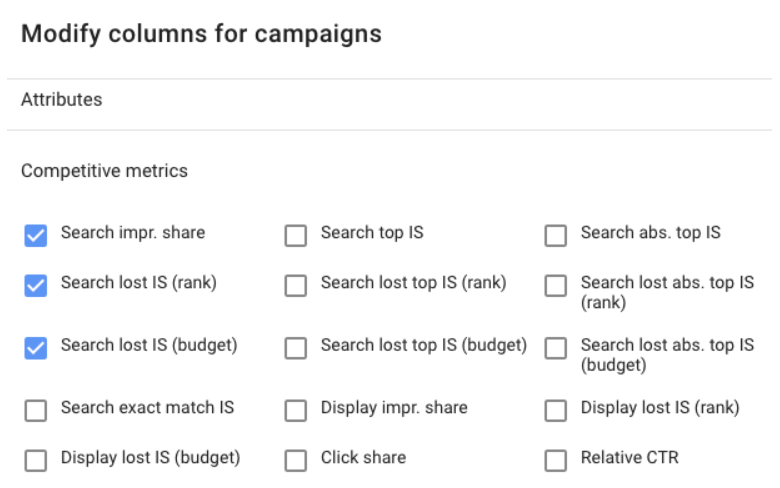
There are two ways to lose Impression Share.
1. You lose Impression Share if you’re limited by budget.
Add the column “Search lost IS (budget)” to your campaigns to see what percentage of Impression Share you’re losing due to limited budget.
If your account is hitting your goals and you have sufficient cash flow, you should increase your budget.
2. You lose Impression Share if your Ad Rank is too low.
Add the column “Search lost IS (rank)” to your campaigns to see what percentage of Impression Share you’re losing due to low Ad Rank.
Ad Rank is primarily impacted by your keyword Quality Scores and your bids. Most accounts will lose some Impression Share due to low Ad Rank, because there will almost always be instances where it’s not profitable for you to show up for some searches that could technically trigger your ads, or where the Quality Score you can achieve is capped (e.g. if you’re targeting competitor names as keywords).
But, if you’re losing 50% Impression Share due to low Ad Rank, that means you probably have issues. Either the keywords you’re targeting are too broad, and you need to tighten them up, or you need to figure out how to improve your Quality Score and/or change your bidding strategy to make your Ad Rank more competitive.
5. Look at Your Data Per Device
People behave differently on their phones than they do on computers. Your website looks different on a phone than it does on a computer. Competitors bid differently for traffic from phones and computers.
For all those reasons and others, you will often see different rates of performance from phones, tablets, and computers.
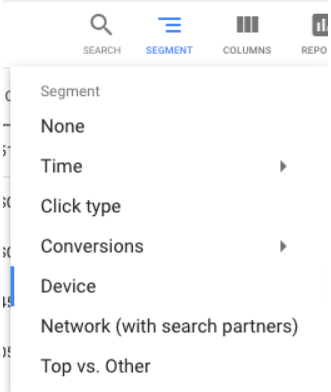
Segment your data by device to look for differences in performance.
1. Segment by device to spot problems with how your website is working on a particular device.
If your mobile conversion rate is way lower than your computer conversion rate, that may be a signal that your website doesn’t look good or isn’t easy to use on a phone.
2. Segment by device to identify bid adjustments to add.
You can increase or decrease your bids per device. If mobile traffic is converting at a 50% lower rate than your computer traffic, and that lower conversion rate doesn’t seem to be due to a specific problem(s) with your website, then you may want to decrease your bids for mobile traffic by 50% because that traffic is worth half of what computer traffic is worth to you.
That’s a little bit of an oversimplification because there are other factors to consider, including cross-device conversions, where people are in the sales funnel, etc. But you get the idea.
BONUS: Free Google Ads Evaluation
Would you like Google Ads experts to do a deep dive into your account and give you feedback on the points above and many more?
My agency, StubGroup, would be happy to give you a free, no-obligation Google Ads evaluation.
We’ll look at what you’re doing, tell you what is working well and what isn’t, and provide you with concrete action steps for how we would improve your performance and increase your ROI from Google Ads.
You can learn more about evaluating Google Ads accounts in this short video from Google and StubGroup.
---
Enjoyed this article? Check out John's Pro Tip on Uncommon Google Ads Strategies