Great seller metrics equal great seller performance. If you want to push your growth forward; then, you should be aware of the reports Amazon has available to all sellers so you can step up your game!
If you’re an active Amazon seller, it is paramount that you keep tabs on your ads and sales data. As you might know, the retail giant expects the best from sellers; and, basically, you can’t improve your selling strategy without monitoring your performance metrics.
Since the information regarding Amazon reports is quite extensive, we will divide this topic into two main categories: Business and Advertising Reports. Further on in the text, we will lay out a summary of the reports you’ll come across in Seller Central.
Get your checklist of 7 Amazon PPC campaign aspects that can be automated
Business and Advertising Reports (Overview)
Amazon Reports can be roughly divided into Business and Advertising reports. They contain key data, such as:
- Units Ordered
- Total Sales
- Page Views
- Sessions (or traffic)
- Conversion Rate or Units Session Percentage
- Buy Box Percentage
There are also six crucial metrics to review in your Ads Reports:
Amazon Business Reports
Units Ordered
As its name suggests, this report details the number of products customers order from you. It’s an ideal report to detect your highest-grossing items; and those that may need a boost.
The more units you sell, the better your rank, of course.
Just like Total Sales, a lack of units ordered is derived from your page views and session, which we’ll talk about below.
Total Sales
This report is composed of the ordered product sales and gross product sales. The first metric is your item price multiplied by the ordered units.
The latter metrics consist of item sales, add-ons, and shipping cost. In a few words, it’s the money a customer spent on getting the product.
Your revenue influences your ranking in the marketplace, so it’s crucial to know precisely how much money you make from your store.
The total sales reported is the cornerstone for the following metrics. It will point to the improvements you must make to boost your success on Amazon.
Page Views
These are the number of visits to your products. Listings are counted separately. So, if a customer views more than one item, each will count as an individual page view.
The great insight of Page views is that you can see the pages with decreased visits immediately. You can spot slumps early and optimize the listing immediately.
You need to determine why a page is not being seen. The cause could be poor pricing or SEO, and even a lack of targeted keywords.
Review your Amazon seller metrics to pinpoint why you are not getting page views. Then, correct the problem to reverse the trend.
Sessions
This report tracks customers’ sessions and page views. It determines which are your most viewed products in the marketplace. The report measures sessions and page view
Imagine this scenario: a customer views one product, but do not add it to the shopping cart.
Then they find your second product and add it to the cart. And maybe they check out a third item, add it to the cart, but then change their minds and remove it.
Each product interaction equals a page view, but there was only one trip to your store. That means the customer had only one session in the marketplace.
Low sessions mean your products are not holding the customers’ interest. The Traffic report lets you pin down the problem. Then you can make the improvements that will increase your traffic.
Conversion Rate
Conversion metrics show your customer delight. In other words, the report marks the percentage of shoppers that add your product to their carts.
The data divides the orders placed by the unique sessions from customers. If 100 customers view one of your listings, but only 34 placed an order, that product has a 34% conversion rate.
The total is your unit sessions percentage.
The average rate is 9.7 percent, and a good percentage goes from 10% to 15%, according to Amazon. A low session percentage translates into low product ranking.
Consider the following steps to increase a poor conversion rate:
- Optimize your listings with high quality images and detailed descriptions. Give customers all the info they want to make a sale.
- Use promotions like seasonal discounts and free shipping to increase conversions.
- Encourage product reviews, because customers value the opinion of other customers.
Satisfied shoppers are always a great reference for your brand.
Buy Box Percentage
The Buy Box is just the price and “Add to Cart” area on a product’s page. Every seller can win the Buy Box but the spot is actually shared between the best rated brands.
So, the Buy Box percentage report shows how often your product gets Buy Box time. in the Buy Box position to customers.
A high percentage means that you are winning the Buy Box regularly. That translates to high sales and conversions. If your buy box percentage is low, then your page views, sessions and sales will take a hit.
The Buy Box percentage report can tell you which products need a boost. There are many factors weighing in winning the Buy Box. Be sure to always check the following:
- Improve customer service and on-time delivery rate.
- Tweak your pricings and keep good stock levels.
- Always check your Inventory Performance Index (IPI) and evaluate inventory management over time.
Amazon Advertising Reports
Search Terms
The report tracks the search terms customers use and click most to find your products. It includes the following metrics:
- Keyword Targeting and Match Type
- Search Term used
- Sales & Conversion rate for specific terms
- Click-Through Rate
- Cost-Per-Click
- Impressions
Sellers can review the most search keywords to increase spend or further target more customers.
For example, you can research and use long-tail keywords, which are more specific terms to target a narrower audience.
Another perk of this report is to detect poor-performing terms, and flag them as negative keywords.
Targeting
Targeting reports keep track of your overall keywords, ASINs, and categories. While Search Terms is issued for specific keywords, this report offers a broad view of all keywords in all your campaigns.
Two great uses for the targeting report are:
- detecting duplicate keywords. You can then replace them with new terms.
- and a second perk of the report is to access your Return on Ad Spend (RoAS), along with your Advertising Cost of Sales (ACoS).
Purchased Product
This report rates keywords performance according to sales. Purchase Product lists the attributed keywords to specific sales.
Sellers can allocate more effective phrase-matching keywords for poor-selling products. You can contain your most relevant head terms to increase sales and revenue.
Advertised Product
Here you can see how all your advertised ASINs and SKUs are performing. This means they’ve won the Buy Box. It basically tells the promoted items that are getting impressions from customers.
Sellers can sort all their best sellers to plan ahead for a busy season, or to boost the performance of your most popular items. Then you can allocate more ad spend to increase conversions and sales.
Placement
This report features performance-by-ad-placement data for all seller’s campaigns.
The last report was about sponsored ASINs’. On the other hand, the Placement reports look at all your ads’ campaigns.
The data will let you refine each campaign by price range, ratings, or shipping. This will allow your campaigns to reach and delight the right audiences.
Each report contains a fair number of figures and graphics. It can be overwhelming at first, especially when you don’t know what to look for.
Luckily, Amazon offers the “Take Tour” feature, which helps sellers understand better what each report reflects.
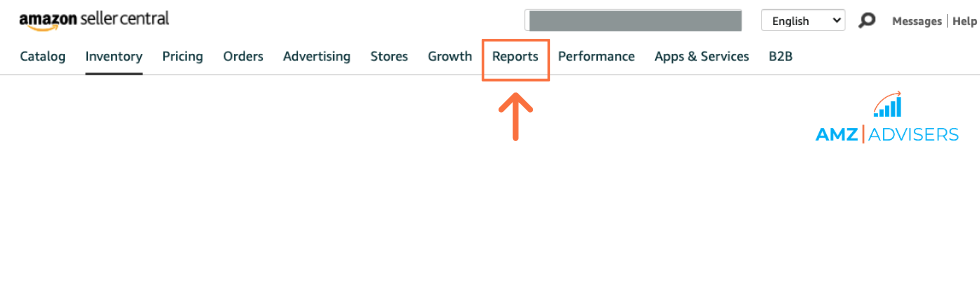
Let’s take a closer look at the Amazon Reports in Seller Central and what they can do for your business.
Amazon Reports in Seller Central -Summary
Your reports represent the story of your Amazon store. Each one reveals how customers interact with your brand.
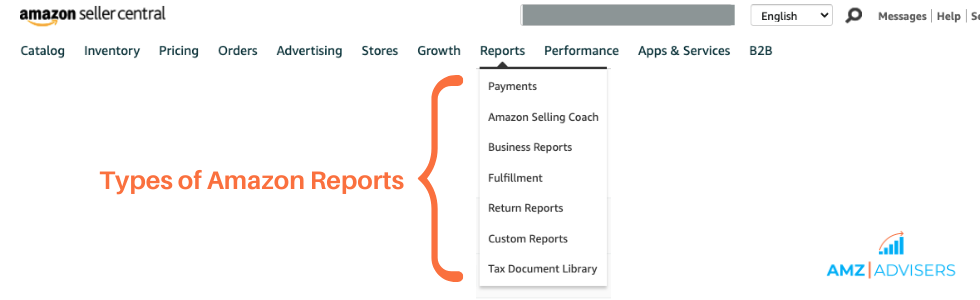
These reports point to specific sales and traffic trends. They can also give you greater insight into your inventory health and fulfillment performance, and you’ll find them displayed as follows:
- Payments
- Amazon Selling Coach
- Business Reports
- Fulfillment
- Return Reports
- Custom Reports
- Tax Document Library
1. Payments Dashboard
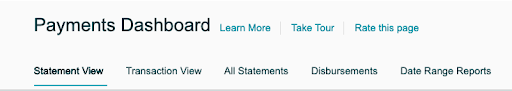
The payments dashboard reflects, as its name suggests, important information about your payments.
This dashboard contains the following views:
- Statement View - You’ll find general information about your Net Proceeds (Net amount from Beginning balance and Sales less Refunds, Expenses, Loan Repayments and amount in account reserve.)
- Transaction View - It allows you to keep track of all your transactions and filter them by type
- All Statements - It provides general but at the same time detailed information about your account statements by settlement period
- Disbursements - You can see a list of your disbursements by date / period
- Date Range Reports - By entering an order number, this tool allows you to track a transaction and generate a report based on the date you marked the orders as shipped.
2. Amazon Selling Coach
The Selling Coach dashboard is divided as follows:
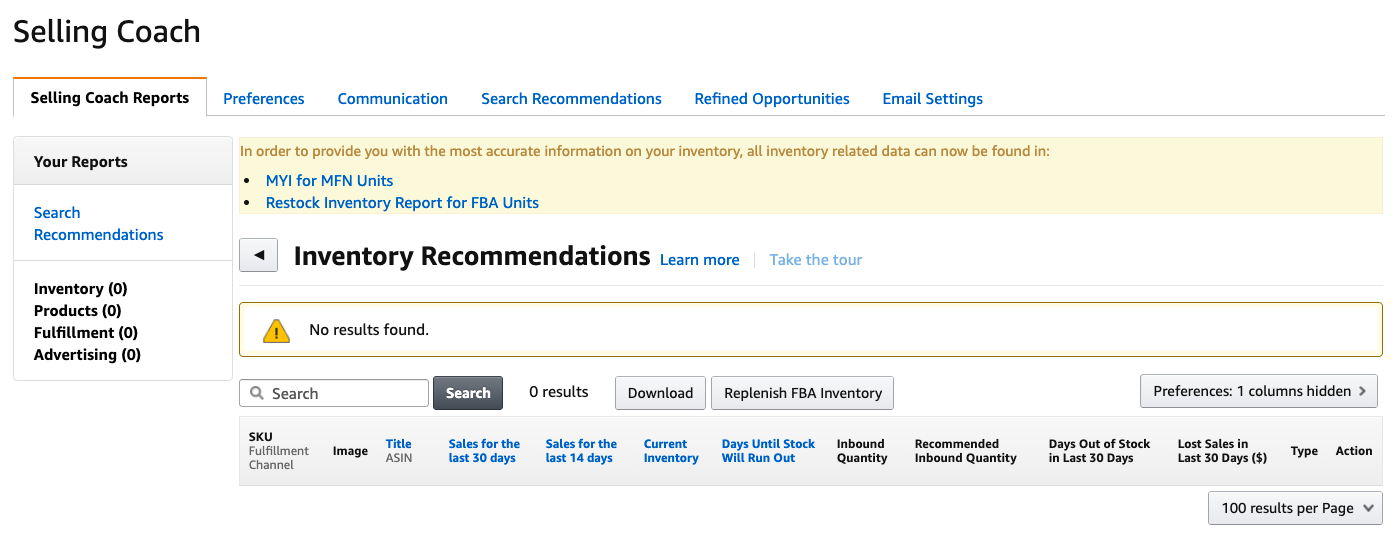
- Selling Coach Reports - You can find recommendations on how to improve your inventory management, products, fulfillment, and advertising.
- Preferences - It shows you a list of popular products that may have limited availability on Amazon and lets you know what opportunities you have to fill that market.
- Communication - You will have access to your Selling Coach emails, communications, and tips for a successful sale and how you can help your customers find your products.
- Search Recommendations - This page allows you to search for recommendations by product title, brand, category, or ASIN.
- Refined Opportunities - This list contains all the items you chose from Selling Coach.
- Email Settings - Allows you to edit language preferences, email address, and notifications.
3. Business Reports

The data in these reports is available for up to 2 years:
- Sales Dashboard
- Business Reports by Date
- Business Reports by ASIN
Amazon indicates that, in these types of reports, you might notice discrepancies across the different report types due to the way data is pivoted and based on the purpose of the report, and because they have a lag of 24 hours when compared to the real-time data.
4. Fulfillment Reports
Amazon Fulfillment Reports is one of the most extensive sections within the Seller Central reports section. Each one is divided into subcategories with an extensive number of reports related to each parent category.
But, in a nutshell, they are divided into six main categories:
1. Inventory
2. Sales
3. Payments
4. Customer Concessions
5. Removals
6. Amazon Global Logistics
One of the most recent updates in this section is that now you can review, and download, information regarding the Long-Term Storage Fee with a period of 6 to 12 months, or more of the report of your health inventory and your recommended removal report.
The formats in which you can download these reports are the following:
- .csv - you can open them in a spreadsheet, leading zeros will not be visible. i.e., 007
- .txt - will allow you to see leading zeros
5. Return Reports
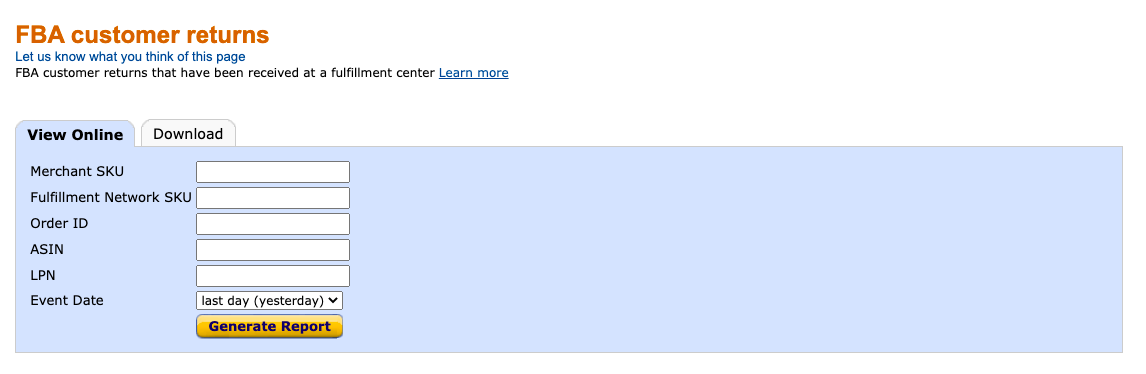
This tool allows you to generate reports related to customer returns. You will be able to analyze important data within the following fields:
- Returned Date
- Order ID
- Merchant SKU
- ASIN
- FNSKU
- Title
- Quantity
- FC
- Disposition
- Customer Return Reason
6. Custom Reports
In this widget, you can generate your own custom reports in Comma-Separated Values (CSV) to view through Excel, including suggestions from Amazon to improve your metrics.
They are divided into two categories:
- Active Reports: newly published reports, and with current file dates
- Archived Reports: old reports, self-archived by Amazon, which are deleted after 45 days
Learn more here.
7. Tax Document Library
Through this library, you will have access to the following views:
- Seller Fee Tax Invoices
- Tax-Exemption Certificates
- [Marketplace] Tax Invoices
Through the Sales Tax Report section, you can generate 3 types of report:
1. Sales Tax Calculation Report
2. Marketplace Tax Collection Report
3. Combined Sales Tax Report
When you sign up for Amazon tax calculation services, you will be provided with a glossary of names and descriptions that will be broken down in your Sales Tax Report. You can access this glossary by clicking on “Learn more,” next to the Tax Document Library title.
Final Thoughts
Study the information you have access to within your Amazon reports and check them constantly to know where your account stands. They will grant your valuable insights into what you must improve.
The rule of thumb is: If you want to push your growth forward, review your Amazon reports to boost your sales. Amazon Analytics tool will be of help here to provide unbiased information on your sales and ROAS.
It may take a bit of time to know the most helpful metrics for you. Every seller has different needs. But if you know where to look, you’ll ramp up your business in no time.
Understanding Amazon’s reports will grant your insight into your account’s health. In short, they can show you how to optimize your business.
Remember, great seller data equals great seller performance!