In the last few years, I've helped a lot of beginner merchants improve the performance of their eCommerce websites with Google Analytics.
The fact is that many eCommerce businesses pay little or no attention to tracking and monitoring key metrics in their online stores. This negatively impacts their ecommerce site without them knowing.
This article is meant to show how Google Analytics can help improve the performance of your eCommerce website.
What’s in it for you?
- Key eCommerce terms in Google Analytics you should know as a beginner and how they can boost the performance of your eCommerce site.
- Step-by-step instructions on how to set up the Google Analytics tool.
- How to read and generate a report.
- How to create transaction goals.
Google Analytics Features Great for eCommerce
There are Google Analytics features meant for eCommerce websites. Whether you’re a dropshipper or you sell your own products on eCommerce platforms like Shopify, Woocommerce, Bigcommerce etc. You need to know these features and how they can impact your eCommerce site.
1. eCommerce Tracking
This is one of the most important eCommerce features you should know as a beginner. It helps to track the activities on your site. Ordinarily, Google Analytics will only track the data of visitors to your eCommerce site and page views.
But that isn’t enough to give you reliable insight. What you should do here is add a tracking code to your site. When that is done, it collects your eCommerce data and sends it to GA.
It might be a difficult task to add a tracking code to your site if you don’t have basic skills in Javascript coding and Html editing. I suggest you get a skilled web developer to handle this for you.
How will it be of benefit to you?
When the eCommerce tracking code is properly set up on your site you will track the following on Google Analytics:
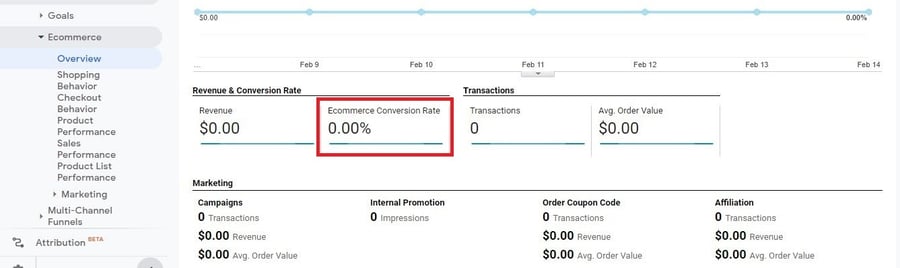
- Conversion rate: This is a key metric you should track as a merchant. Why? Because you want to make as many sales as possible. It is simply the percentage of shoppers who visit your online store and actually made a purchase. Take this for instance - your online store records a monthly visitor count of 100,000 and 1,000 visitors out of this number made a purchase (Conversion). Then the conversion rate of your store for that month is 1%
Here is the formula:
Conversion rate = (conversion/total visitors) × 100.
To view this metric:
1. Log in to your report
2. Hover to eCommerce
3. Click on Overview.
- Traffic metrics: You need traffic to your eCommerce store to make sales. Traffic metrics refer to the number of people that visited your eCommerce site, how many separate visitors, average duration, source of traffic which could be direct, referral, paid, or organic traffic.
Also when you launch a marketing campaign and use the UTM link, Google Analytics will track each hit and tell you which of your marketing channels perform better.
- Cart abandonment rate: Not every shopper that adds products to their cart goes ahead and pays for it. There are many reasons for this happening.
A 2020 study by Baymard found that 58.6% of online shoppers in the US abandoned their cart simply because they weren't serious about buying. They took this percentage of shoppers out of the equation and asked the rest to specify their reasons for leaving items in their cart behind.
- 50% thought additional costs like shipping were too high
- 28% didn't want to create an account
- 21% found the whole checkout process too long
- 17% didn't feel safe giving their payment information
- 10% didn't like the return policy
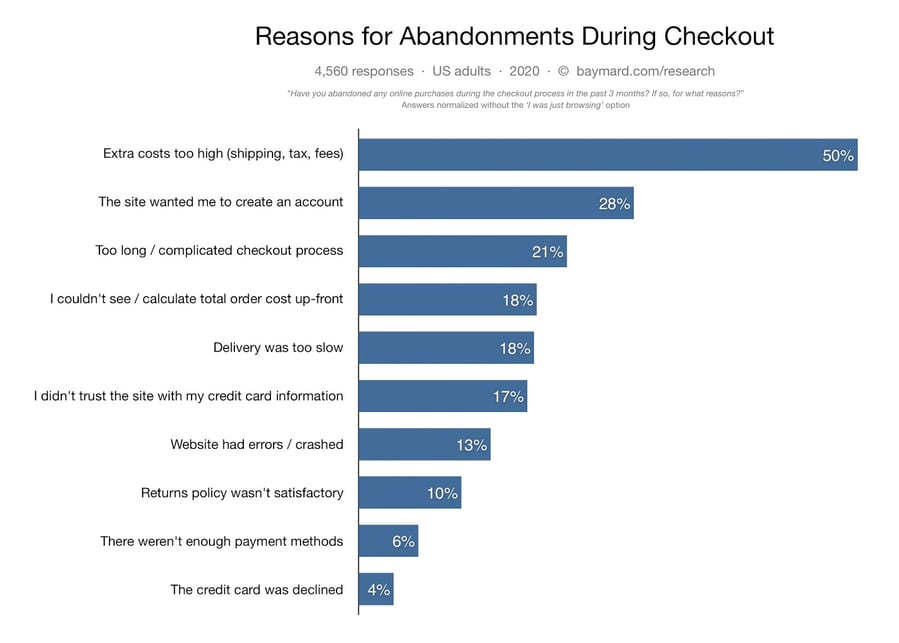
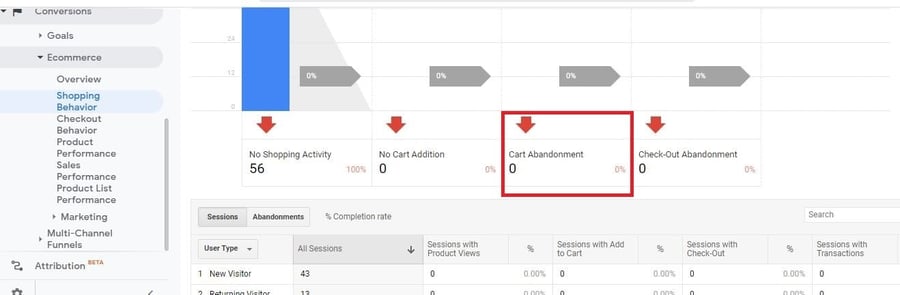
That’s why eCommerce merchants opt for shopping cart builders to provide the best user experience. On Google Analytics, you can see the percentage of shoppers who left your site after adding products to cart.
- Revenue: As an eCommerce merchant who is just starting out, I’m sure you’re anxious about generating revenue from your online store.
That’s normal because it shows that you’re making progress. Here you see how much your eCommerce site has generated over a period of time.
These are just a few of the metrics you can track when you set up your eCommerce tracking code well. There’re many more of them and it’s up to you to decide which ones matter most to you.
2. Custom Alerts
You may be too busy to monitor your eCommerce site or blog every now and then. But with Custom Alerts, it is doable without stress.
This is as simple as setting up a notification on happenings on your website as it concerns the metrics you care about. To set Custom Alerts, on your dashboard, click on Customization. There you'll see Custom Alerts.
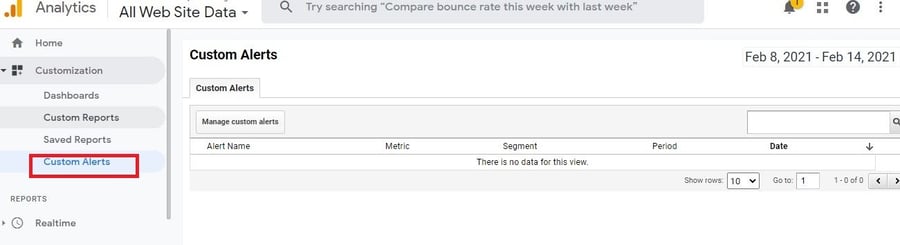
An example could be an alert when your cart abandonment rate goes above 70% or when your conversion rate hits 5%.
The frequency depends on you. You can set the alert to be daily, weekly, or monthly. Alternatively, you can check the 'Send me an email' box if you want to receive an email when the alert generates.
The benefit of Custom Alerts is that you can take action swiftly when there is any negative development that, if not tackled instantly, can harm your site.
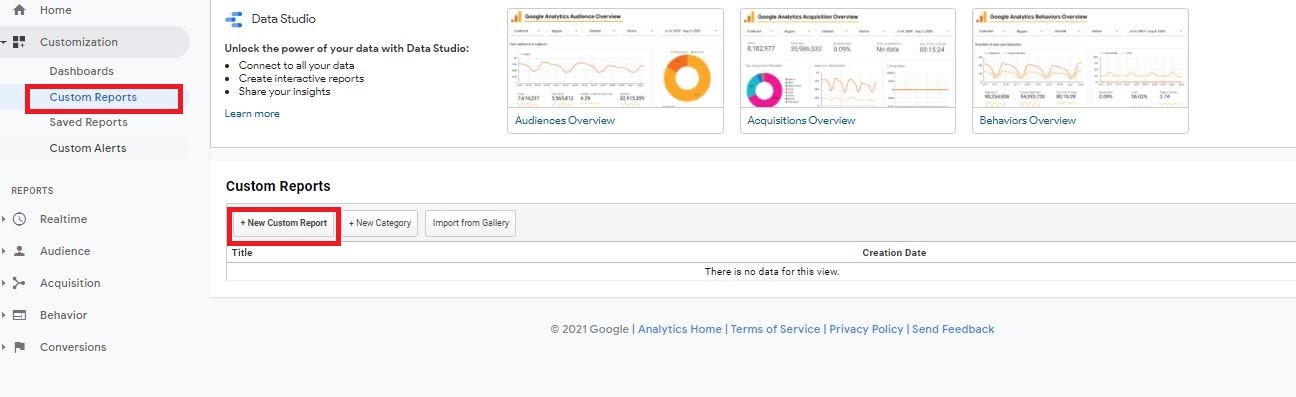
3. Custom Reports
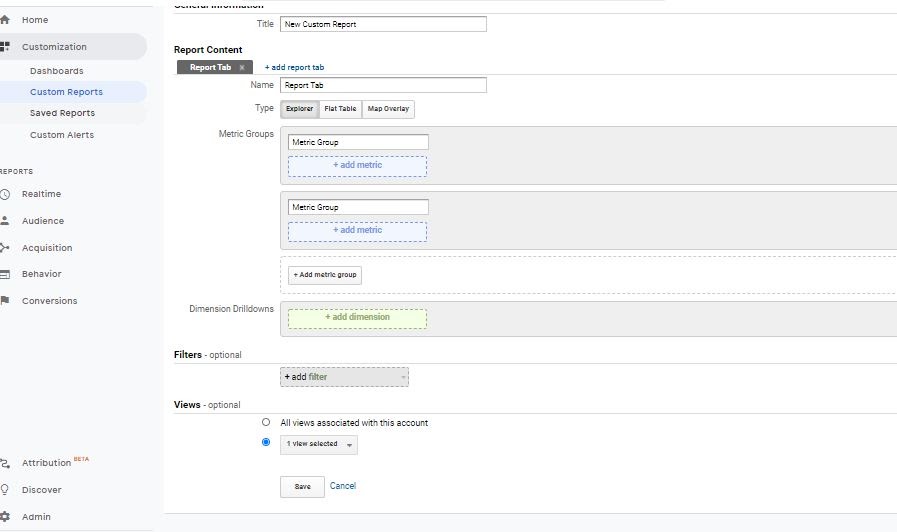
Custom reports is a feature on Google Analytics that allows you to create and customize reports based on the metrics you care about. Instead of navigating various tabs on Google Analytics, you can use this feature to generate and read reports that matter most to you. I recommend this feature if you run a marketing campaign. Creating it is simple. Just pick the dimensions and metrics.
Dimensions could be gender, device, location, age, etc. While metrics could be landing page, bounce rate, page views, average time on a page, etc.
To create a custom report, Login to Google Analytics. Hover to the left hand side of your dashboard and click on Customization > Custom Reports.
Click on + New Custom Report to begin from scratch.
 After that, give your new custom report a title. Then add the dimensions and metrics you want and click 'Save'.
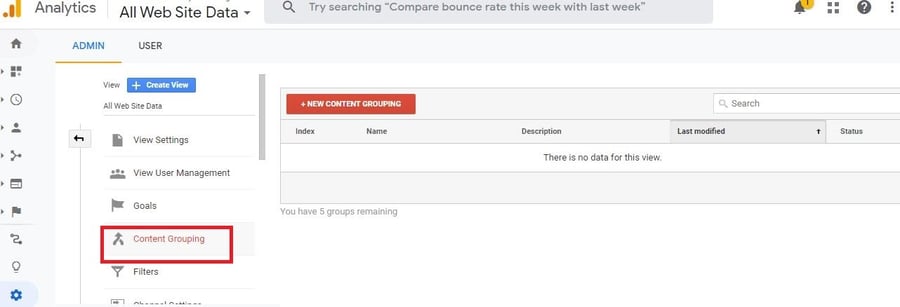
4.Content Grouping
Content grouping allows you to group the pages on your eCommerce site into categories. Just like every other website, pages are what make eCommerce websites. With content grouping, you organize and group your pages logically. The aim is to understand how each of the pages performs in the group. To create Content Grouping, from the Admin, Click on View and select Content Grouping.
For instance, you have an eCommerce site that sells footwear.
It makes sense to create a group for women, men, and children pages.
In each of the groups, you can create groups for men's shoes vs men's sandals vs men's slippers pages. You can repeat the same for women and children groups. Exactly 24 hours after you create a content grouping, the data begins to generate in your report.
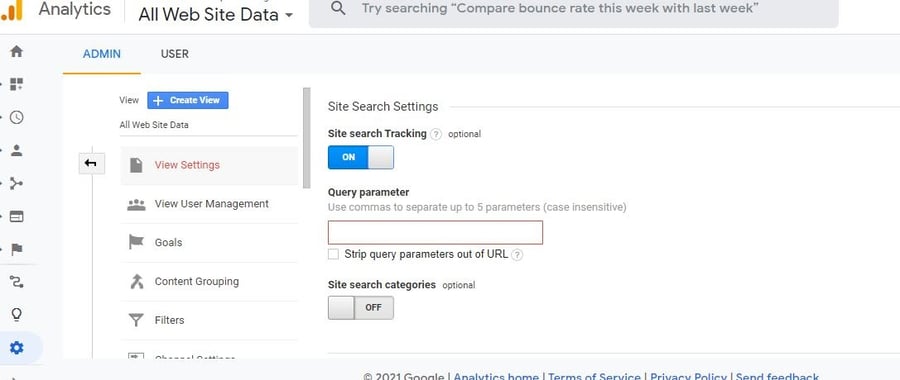
5.Site Search
When shoppers land on your eCommerce site, they perform a search to find the products they want to purchase. It’s important you track these terms. That’s why you need to turn on Site Search.
When it is enabled, not only will you track search terms but also their behavior after a result was returned for the search they performed. The benefit of this is that it can help you optimize your site for more visibility, either through product keywords or the design of your store’s home page.
To turn it on, go to Admin, select View. Click on View Setting.
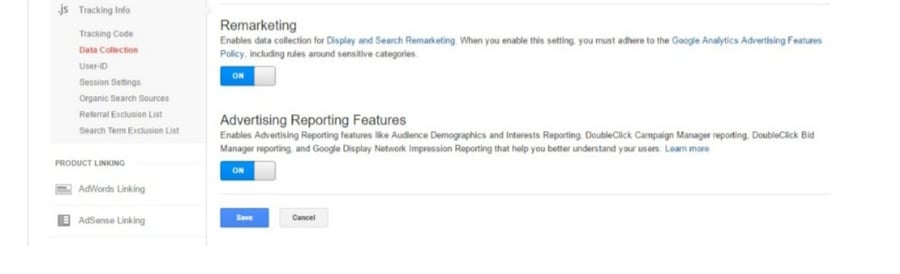
6.Remarketing
Remarketing is a term that describes the action you take to bring back a shopper who visited your site but didn’t make a purchase. For sure, only a few percentage of visitors who land in your store will convert to sales.
Now, what happens to the larger percentage that didn’t patronize you? What can you do to convert them to paying customers? The first step is to enable the Remarketing button.
This makes it easy to retarget them on Google networks. It impacts your conversion rate positively as you will have some of those shoppers returning to make a purchase at your store.
![]()
How to Set Up Your Account (Step-by-Step Guide)
Now that you know some of the eCommerce features on Google Analytics, let’s take a look at how you can set up this tool yourself.
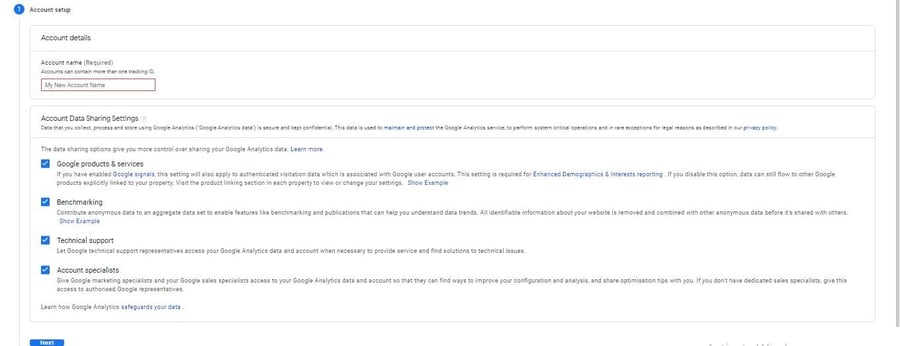
Step 1: Create a Google Analytics Account
Head to Google and input Google.com/analytics. Click on start for free. Sign in using your Google account. This can be your email account, YouTube account, or any other account you have with Google.
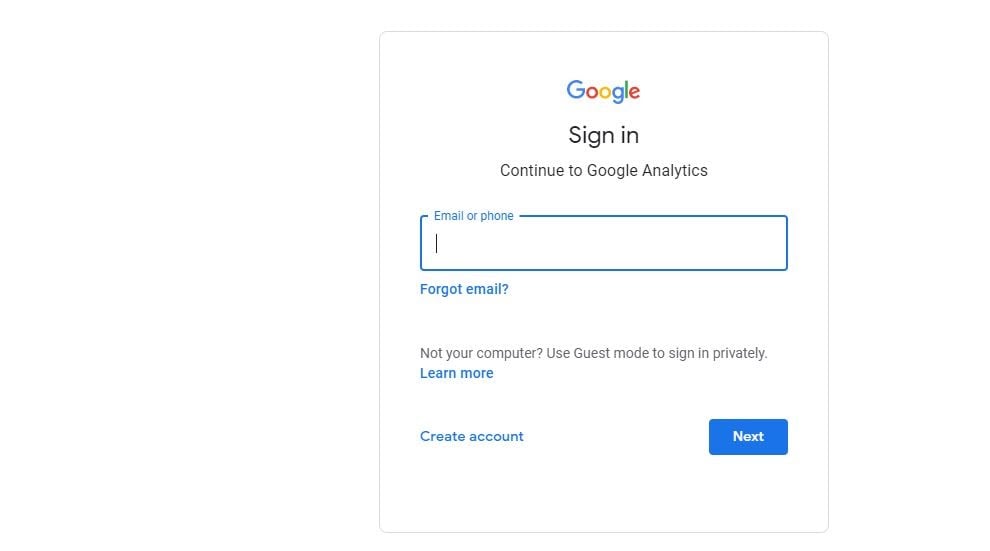
There is an option for you to create one below if you don’t have any. When you log in, click on Start Measuring.
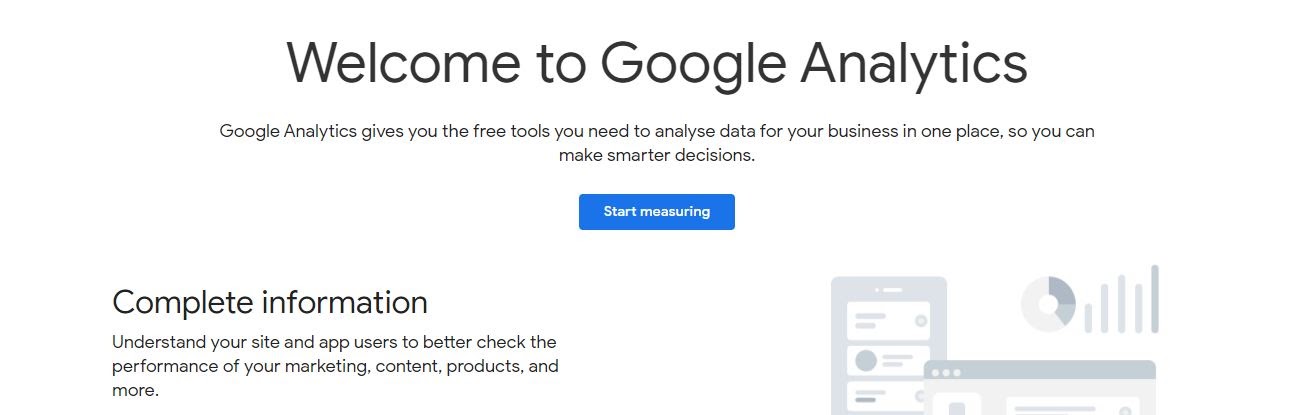
Add your account name and leave all the boxes checked. Then click on next.
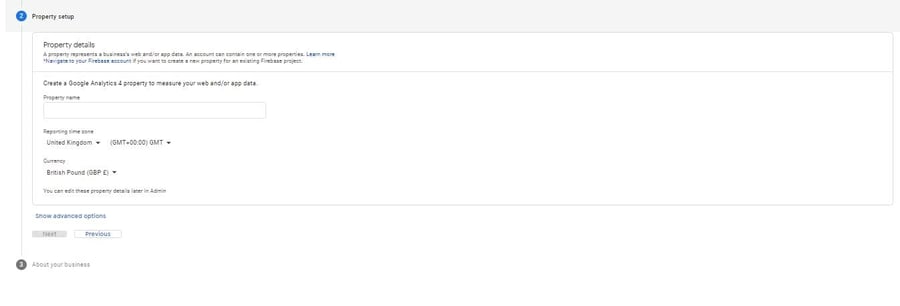
Step 2: Select what you want to track
These are your choices: App, web, or App + web. Here you want to track your eCommerce website.
Enter the name of your site, URL, and category. Then choose your time zone so that your reports will synchronize with your local time. Click Create.
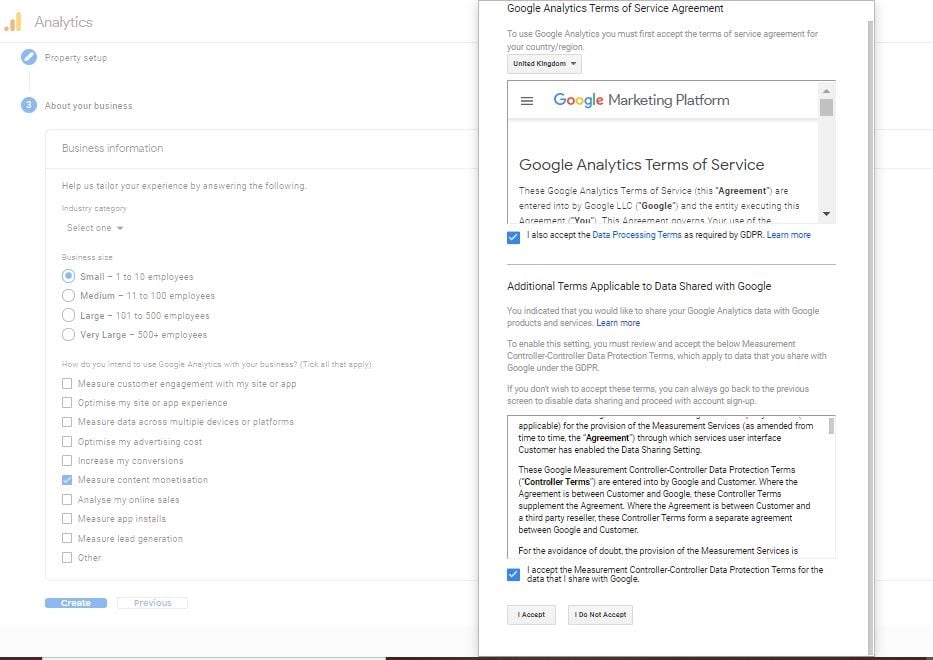
Step 3: Agree to Google Analytics terms of your country by ticking all the required boxes.
Step 4: Install the tracking code
To collect data and see reports on Google Analytics it is compulsory that you install the tracking code on your website. This code should appear automatically after you create an account on GA.
But don’t worry if you didn’t see it. Simply go to your dashboard, click on Admin, Tracking Code Info, and then Tracking Code.
![]() You will see your tracking code. If you use Shopify, Wix, Squarespace, Bigcartel or Weebly as your eCommerce website builder, this is simple to add. For example, on Wix hover to your dashboard and click on Marketing Connections. You will see an option to connect to Google Analytics.
You will see your tracking code. If you use Shopify, Wix, Squarespace, Bigcartel or Weebly as your eCommerce website builder, this is simple to add. For example, on Wix hover to your dashboard and click on Marketing Connections. You will see an option to connect to Google Analytics.
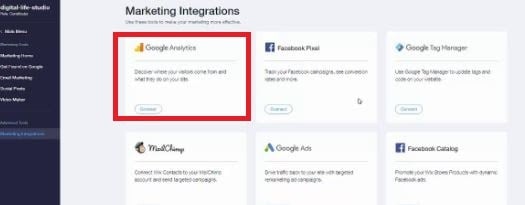
Paste the tracking code and click save. That’s it. You have set up Google Analytics on your eCommerce site.
To confirm if you got your set up right, you can visit your site through the incognito tab of your browser. Login to your GA account 24 hours after the set up to see the report.
![]()
How to Generate and Read Reports
Once you have installed the tracking code from Google A on your website, you will begin to generate reports on your GA account. You can also decide to create a custom report by picking dimensions and metrics.
To read your report, login to your GA account. On your eCommerce dashboard, click on Overview and you will see at a glance the report generated for a particular period of time.
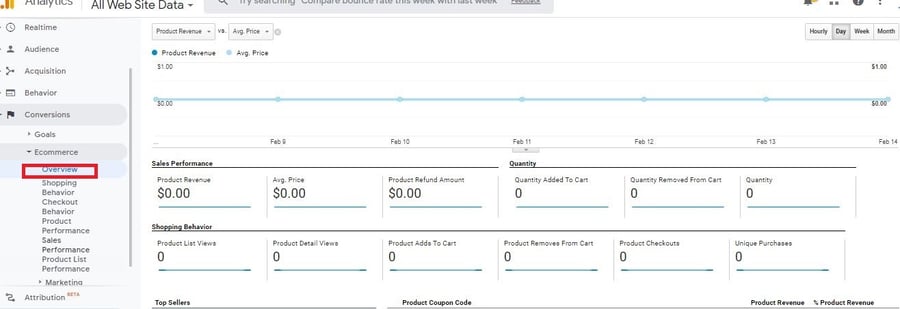
![]()
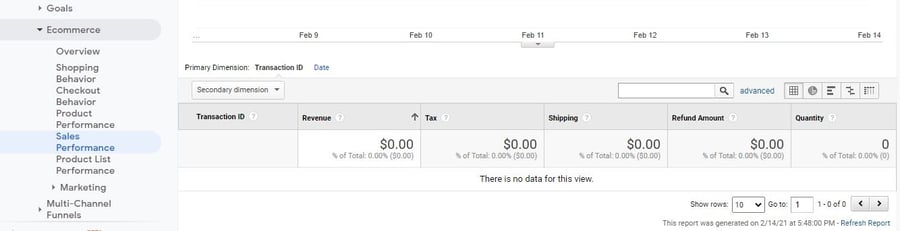
How to Create Transaction Goal
Creating a transaction goal is important for your ecommerce website. With it you can measure how your site meets the number of transactions you expect in your online store over a period of time.
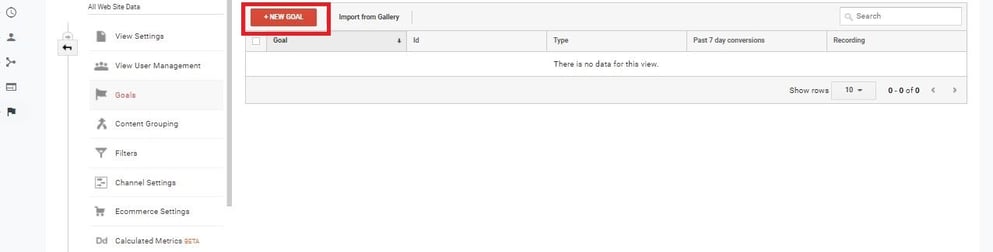
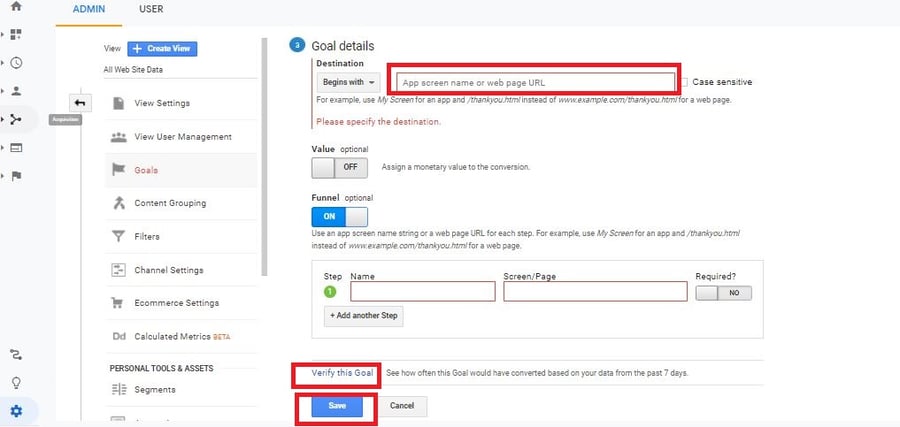
Login to your Google Analytics and on your dashboard, hover to Admin. Click on Goals.
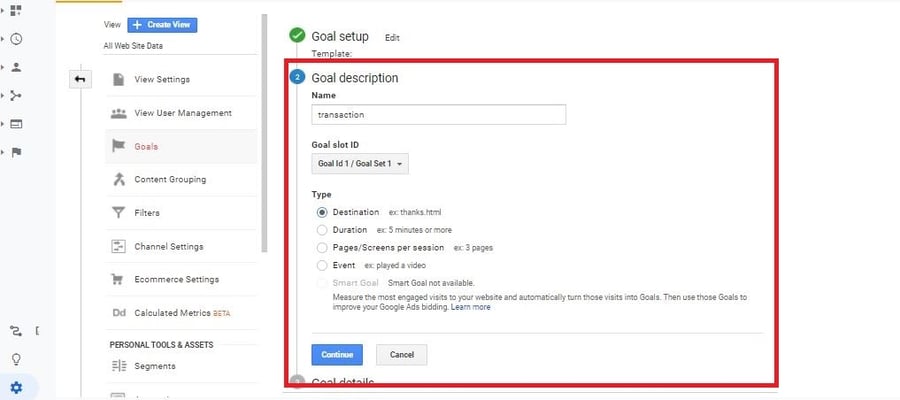
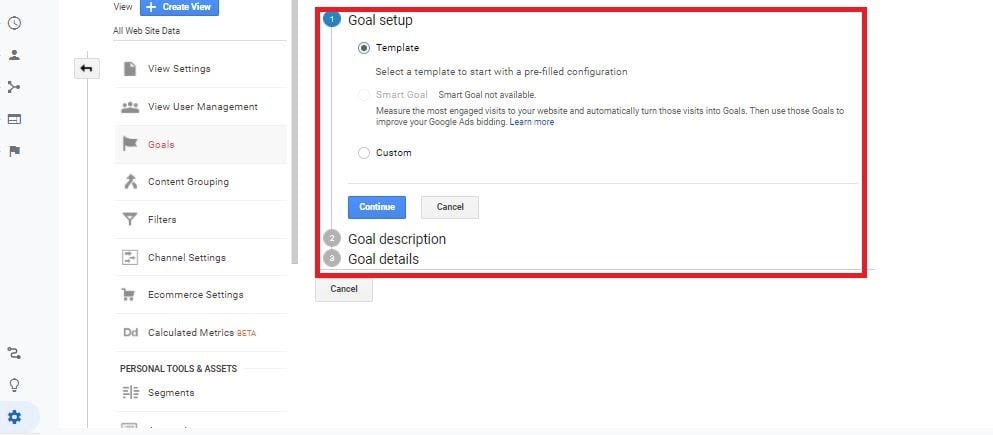 Name your goal and choose Destination as your goal type. Click on Continue
Since you are a merchant who sells online, insert the URL of your ´Thank You´ page or any page which shows that a transaction (purchase) has taken place in your store. You can decide to input a monetary value or enable your funnel. These are optional.
All the goals you’ll build will fall into one of four main types:
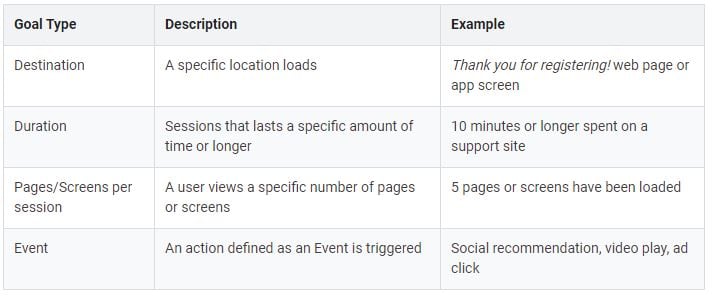
Source: Analytics help
Here are a few examples of the most popular transaction goals, useful for eCommerce businesses:
- Page Views of Key ages
- Account Creations
- Order Confirmation
- Quote and Information Requests
- Shopping Cart Funnels
- Clicks to Call or Email
- Offline Ad Conversions
![]()
Wrapping Up
The benefits of Google Analytics for your eCommerce store simply can’t be overemphasized. Analytics data can be used to enhance your campaigns in many ways, like knowing how and when to change your budget or which products are selling the best.
As a merchant, the more in-depth information you have, the better. It's important to always keep your eye on what’s happening with your store’s data. By knowing how to read reports accurately you're able to unlock this information and make informed decisions to increase the performance of your campaigns.
Google Analytics is changing. Read: GA4 vs Universal Analytics: What's New?