When it comes to advertising, Google Ads is highly regarded. The platform is relatively easy to use and reaches a substantial audience, if done correctly. But what makes Google Ads truly exceptional is the reporting overview of your advertising. Google’s love for data is made very clear with almost every parameter you can think of - from yearly spending and ad views, to CPC and impression demographics. All of which contributes to tracking the effectiveness of your advertising campaigns.
In this article, we will discuss the importance of Google Ads reporting, as well as the variety of metrics and what they bring to the table.
What Are Google Ad Reports
In short, Google Ad Reports are performance metrics that measure the success of your advertising campaigns. The reports can tell you anything from how many people clicked on your ad to the type of person who clicked it.
These metrics then give you an insight into what is going well, and what is not going as well with your ad campaign. The metrics can also highlight any issues with your ad campaigns. Such as if you are not reaching the right type of person, not managing to convert those you are reaching, or whether you are simply not reaching a high enough quantity of people.
Google Ads Report Editor
If you want to try something a little more expert, you can try using the Google Ads Report Editor. The report editor allows you to create tables and charts within Google Ads, eliminating any need to download data to analyse it. Using a simple drag and drop interface, the editor allows you to segment data to analyse, as well as filter and sort data. This all contributes to easier and more organised analysis of your advertising campaigns.
To use the report editor, first you need to sign in to your Google Ads account. After that, click the reporting icon in the top right hand corner of the screen, before selecting reports. You can then click the plus button in the top left hand corner of the screen, and select any chart or table of your choice.
Return to top of page or Download The Ultimate Google Merchant Center Handbook
The Role of Reports
Reports have an essential role when it comes to understanding the successes and failures of your advertising campaigns. They give you detailed feedback in the form of data, that allows you to measure the effectiveness of a campaign, and make adjustments based on the data available. As Google is so thorough, there is a wide range of data available.
Another effective way to use data from reports, is to use double segmentation. This means choosing metrics such as time of day, language and device type used and using them together. For example, mobile users clicking an ad between 1-3pm. By double segmenting, the data you get back from the report is intricately detailed and can often offer more in terms of actionable insight.
Return to top of page or Download The Ultimate Google Merchant Center Handbook
Report Types
There are many types of report type that can be used within Google Ads. We are going to focus on the main types of report categories, which are extensions, analytics & shopping. Here are some of the main features of those categories:
Extensions
Extension reports provide data for any call based or feed based extensions you may have on your advertising campaigns.
Analytics
Analytics reports give you a better understanding of your ads general performance. This can be related to a singular ad, a group of ads, an entire campaign, or keywords. Analytics tracks metrics such as bounce rate, average time on site, new visitors and more. However, you can easily check these metrics in the columns of the platform, if you don’t need to double segment.
When discussing the importance of Google Ads reporting and the variety of metrics available, one key aspect for advertisers to consider is leveraging a reliable Google Analytics reporting tool. This tool can provide valuable insights and analysis to enhance campaign optimization and decision-making.
Shopping
Shopping reports provide statistics related to your Google Shopping advertisements. It includes the product partition report and the shopping performance report.
Return to top of page or Download The Ultimate Google Merchant Center Handbook
Metrics & Visuals You Should Use
Although most metrics on Google Ads Reports will be relevant to someone, certain metrics are more valuable. This is because regardless of your advertising campaign, everyone will need them to a certain degree. Here are 5 of the most important metrics and visuals in reports:
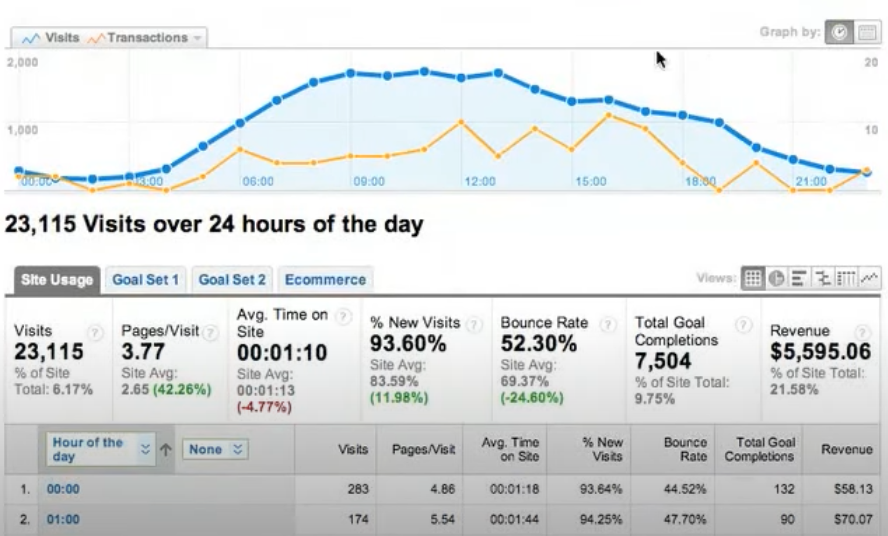
Analytics metrics and visuals
Analytics metrics and visuals are great ways to better understand those who see and click on your ads. Analytics can give you information on the length of time someone stays on your website, as well as bounce rate and the amount of pages they visit. This can help you understand whether the visitor may be liable to a future purchase and can also help with retargeting.
Campaign volume over time
This is a fantastic, must use visual. Campaign volume over time allows you to compare all your campaigns against each other over time. This allows you to weed out the weakest of your campaigns and work on improving the campaign itself or the keywords.
Impression share by device over time
This is a very useful visual, as it allows you to compare the success of your campaigns over every device. If you campaign is struggling on one platform more than others, it is likely it needs optimising for the platform. Remember, descriptions on mobile and tablet devices are shorter. This can be the difference between success and failure.
Regionalised cost and performance visuals
These visuals help you to gain a better understanding of how your campaigns are performing in different geographic areas. The visuals are perfect when used with impressions, clicks and various analytics metrics such as bounce rate.
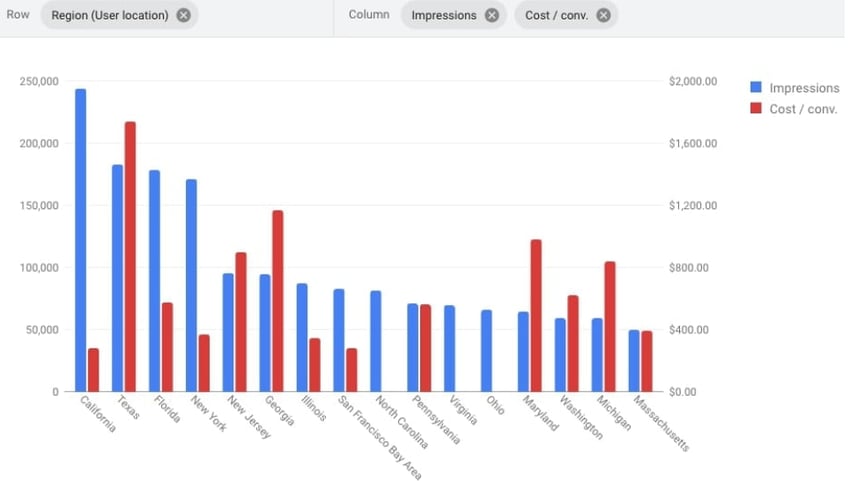 Source: PPCHero.com
Keyword search volume over time
This visual allows you to see the most searched keyword phrases that lead to clicks on your ads over a certain time period. This helps you to see the best performing keywords, as well as keywords that are losing your funds.
How To Read A Google Ads Report
Reading a Google Ads Report can be overwhelming at first. There is a substantial amount of data to waide through, and it may not all be relevant to you. Here is a short plan of action for you to find the metric you want:
- Your first course of action should always be to define what you want to know. Google collects a significant amount of data, so in most cases, the field will be there.
- Next up, you should decide whether you want to find data from a campaign level, for a single ad group or for a keyword. Campaigns are listed prior to taking any action. To reach ad groups, simply click a campaign. To find a keyword, click the ad group.
- Should you wish to see data for a certain time of day for a keyword/ad group/campaign, select the day parts menu on the left hand side. Here, you can also use graphs to better visualize the data. Graphs can be enabled at the top of the page.
Return to top of page or Download The Ultimate Google Merchant Center Handbook
Google Ads Reporting - Best Practices
When using Google Ads reports, it is essential to use metrics in the right way. Here are some best practices to help guide you when using reports:
Have a clear goal
When using reports, you should always have a clear goal in mind. This could be to measure results, experiment with ways to improve an ad, or find a more precise and effective way to reach a certain target demographic/geographic profile.
Once you have a goal, you can gain a better understanding of what the metrics are showing you, as well as what to change to improve your advertising success.
Use context with your analysis
Context is important as it will give you a wider perspective on your ad performance. For example, if you are running an ad for sunglasses year round, it will generally perform better in summer than in winter. Context will help you avoid wasting your advertising spend on inappropriate products, keywords and more. It will also make it easier to spot poorly performing keywords and ads.
You should also avoid making flash judgements on campaigns. If a campaign is new it may take a while to start getting sufficient data to make a judgement on its successes.
Focus your analysis where it matters
Use filters to highlight the most important metrics for your campaigns. This will make it easier to notice issues and successes. Further segmentation of your data can also make it easier to spot any issues at every level of a campaign.
Using charts and graphs will also help you to have a better overview of your metrics. Visualising data makes it easier to notice trends, especially when there is a substantial amount of information to take into account.
Personalise your reports
By personalising your reports, you make sure the focus is on exactly what you need. You can save your most important metrics so make them easily accessible for recurring analysis. In addition, you can even add custom columns to focus primarily on the metrics which you know drive your ad performance the most.
Return to top of page or Download The Ultimate Google Merchant Center Handbook
Get the Most Out of Predefined Reports

Matthew Lally, Groth Marketing Consultant and eCommerce manager of TheGiftYak.com who shares his passion for Digital Marketing on his YouTube channel gives away his secret insights as to how to use Google Ads Reports best.
I've managed more than $50 million in Google advertising for hot Silicon Valley startups. In recent years, Google has introduced more support for their Google Ads Report product. As a practitioner, I've found the most success and ease of use with predefined reports.
Predefined Reports are found in the Tools & Settings tab within Google Ads. These were formerly known as Dimensions reports and they're effectively simplified Excel pivot tables. They make it very easy to find actionable data to make optimizations for your campaigns.
As a marketer, your time is valuable. These pre-defined reports allow you to quickly pull data over different date ranges and with different parameters.
The following reports are the ones I believe have the most value (return on your time spent!).
- Search terms report
- Time report
- Landing Page report
Final Notes
Google Ad Reports allow for a great insight into the successes and failures of an advertising campaign. And although understanding which data is relevant for you can be a challenge, it is
worth taking the time to assess.
Using Google Ad Reports metrics can be beneficial for both existing and future campaigns. Whether you want to measure results, find the best way to change your strategy, or simply hope to learn more about engaging a certain type of audience, Google Ad Reports has all the data you need to make a positive change to your advertising campaigns.
Learn more about Google Ads:
- Google Shopping vs Search Ads: which is best for you?
- Everything You Need To Know About Google Text Ads
- Automate Google Search Campaigns Using a Product Feed
- How to Increase Ad Relevance Using Responsive Text Ads Tool
- Creating Attention-Grabbing Google Text Ads [11 Examples You Can't Miss]
- Google Ads Conversion Tracking with Cart Data
- Optimize Google Ads Conversions