When it comes to managing a Google Ads search account it's not uncommon to be overwhelmed by the enormous amount of metrics available for you to report on. Especially if you are new to PPC, you might be wondering which metrics actually determine Google Ads' success.
Unfortunately, there isn't one single answer to this question. It very much depends on your business' goals and industry. Since DataFeedWatch is all about eCommerce, I will focus on what metrics you definitely need to look at if you work in this industry.
I will list them in order of importance.

#1 Revenue
#2 Cost
#3 ROAS
#4 CPC
#5 Search Impression Share
Conclusion
#1 Revenue
If you work in eCommerce, it means your company sells products or services online. However, I would generally exclude subscription-based services from the eCommerce industry.
Usually, eCommerce websites merchandise products on listing and product pages where users can add them to the basket. Once added one or more products to the cart, users can eventually complete the purchase. Every purchase is different. The cart size matters as well as the price of the products sold.
For example, Amazon sells a wide range of products from cheap stationery items to expensive kitchen appliances. A user purchasing a notebook on Amazon is performing a single transaction (or conversion). A user purchasing a kitchen appliance is performing a transaction too. However, it is clear how these two transactions are not the same at all. The first one might have generated €5 revenue, the second one €3000. Therefore, you might see these transactions as two conversions in your Google Ads or analytics platform, but they brought in very different amounts of money.
Now, if I were to ask you what would you care the most about between these two metrics, conversions and revenue, which one would you choose? I bet you would choose revenue! It might get even more complicated.
Let's take the example of an airline that sells flight tickets to Australia. A customer might book a flight to Sydney for himself and his wife. Another customer might book the very same flight on the very same date for himself, his wife, his 4 children, and some family friends. You would easily understand that the value of these two transactions is very different. Although both customers purchased the very same flights on the very same date.
Now, imagine that these transactions were driven by a click on a Google Search Ad. What you would see on your Google Ads dashboard are two clicks and two conversions. Both clicks and conversions would look exactly the same. However, if you actually check the revenue that these transactions generated, then you would find out that the second conversion was way more valuable than the first one, and so was the second click.
Therefore, like conversions, also clicks might have different values. This is something that an eCommerce marketer should always keep in mind!
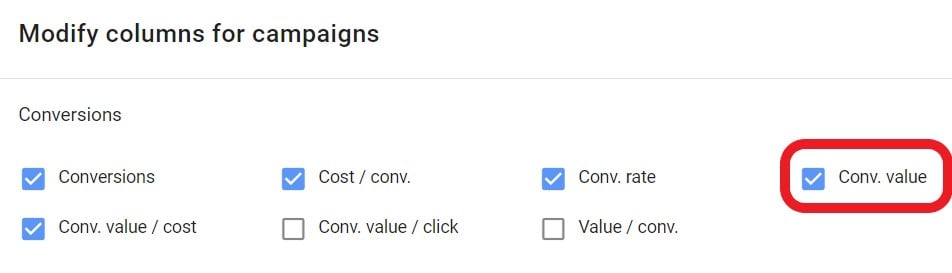
Now, in the Google Ads dashboard, you won't find "revenue" as a metric. Instead, you would find "Conv. value", which stands for "Conversion Value". You can report on the conversion value at the keyword, ad, ad group and campaign level.
You can even go more granular and check the conversion value at the audience and ad extension level. This is by far one of the most important metrics in Google Ads, therefore it is widely available in all reports.
Simply add the conversion value column:
For example, "Campaign 1" generated €103k and "Campaign 2" €78k in the same given period.
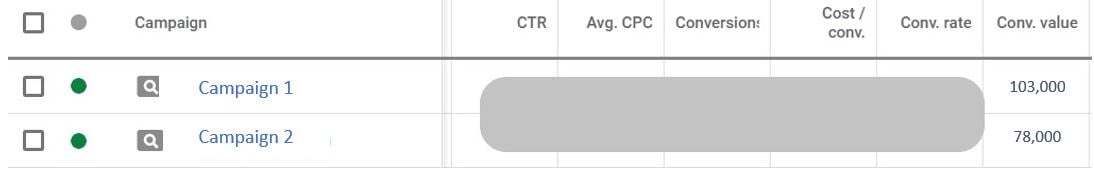
Based on these revenue figures, I would make strategic decisions.
Which campaign generated the most revenue? why some campaigns are not generating enough revenue? and so on.
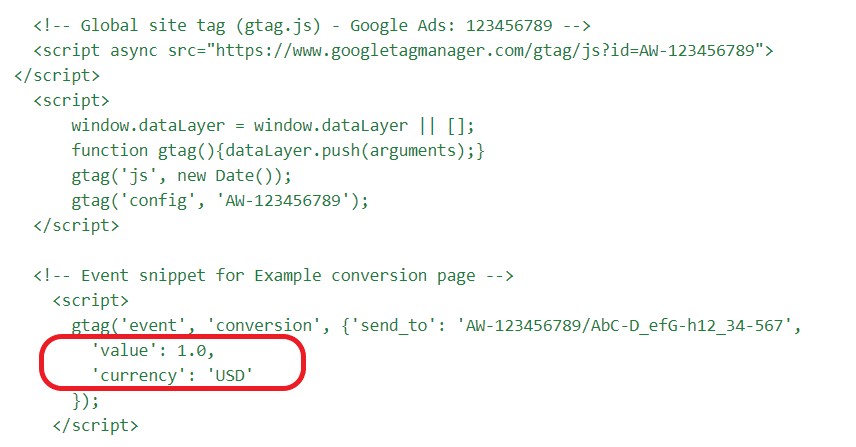
Beware that the Google Ads conversion tag doesn't pass conversion value by default. You need to update the tag on your website to pass conversion value data and currency. See the full instructions here.
Go back to the TOP or ![]()
#2 Cost
Cost is the other side of the coin of Google Ads reporting. In the previous section, you learned that not all conversions are equal and that different search campaigns can generate different revenue.
Well, obviously they might also have different costs. On Google Ads you can set a campaign budget per day (daily budget). Some PPC managers make the mistake of thinking that this daily budget is effectively a cost cap. They think that they would never spend more than their set daily budget. Ideally, they would like to spend that same amount every day. This couldn't be further from reality, unfortunately.
In the case when search volume unexpectedly increases, Google allows your campaigns to spend up to two times your daily budget. At the same time, it would spend less than your daily budget on those days where the demand is not as strong. In fact, your daily budget is an average over a 30.4 day period, rather than a daily cap.
The Google Ads Help Center states that: "over the course of a month, we won’t charge you more than your average daily budget times the average number of days in a month (30.4). For campaigns that are paused in the middle of the month or that otherwise don't run for the full month, you may see discrepancies between your average daily budgets and your total charges."
This means that the Cost is a metric you need to take a close eye on! It is not enough to set a budget and let campaigns run. You need to possibly adjust it multiple times a week to adapt it to the market's demand and your spend targets. In search advertising, we call this "cost pace" or simply "pacing".
You want to make sure your daily spend is in line with your goals, stays under control and keeps a constant pace, rather than jumping up and down.
Go back to the TOP or ![]()
#3 ROAS
The ROAS (Return on Ad Spend) is probably the first metric I would look at on a daily basis.
This is an essential metric as it gives a broad overview of how the search account is performing. While Revenue and Cost are two sides of the same coin, ROAS is the coin itself. Thanks to the ROAS metric you can put revenue and cost in perspective, rather than look at them individually.
ROAS is defined as Revenue divided by Cost
ROAS = REVENUE / COST
In Google Ads it is actually called "Conv. value / cost"
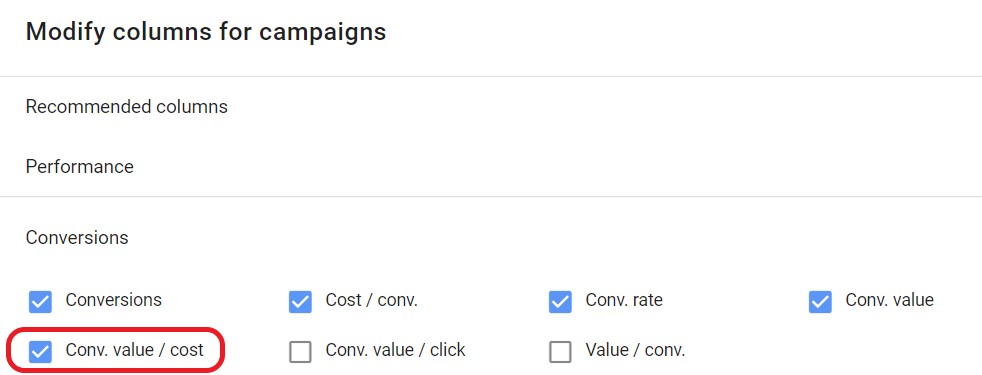
Weirdly enough, it is expressed as a number in the reports, but as a percentage when used as a target in smart bid strategies.
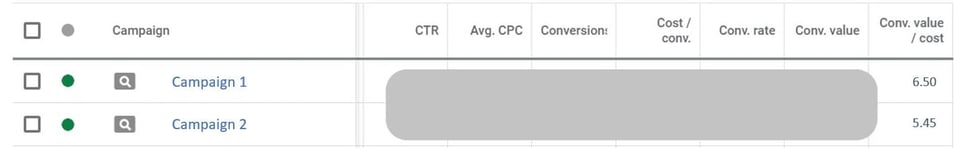
"Campaign 1" achieved a ROAS of 6.5, which means that it generated revenue 6.5 times the cost.
"Campaign 1" ROAS = campaign cost x 6.5 or "Campaign 1" ROAS = campaign revenue / campaign cost = 6.5
If you want to use the Target ROAS bid strategy bear in mind that you need to convert the aforementioned ROAS figure into a percentage.
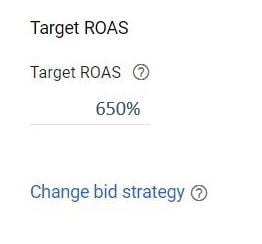
ROAS of 6.5 in the report columns means ROAS of 650% in the bid strategy. In business reporting, ROAS is also indicated as 6.5x. Which basically means "6.5 times"
Why ROAS is so essential?
Because it represents the ratio between revenue and cost, ROAS tells you how well you are spending your ad dollars.
A ROAS below 1 means that you are spending more money than the revenue you are bringing in. Definitely a scenario you don't want to find yourself in.
If you find campaigns with ROAS lower than 1, they might need some optimisation or possibly being paused.
At the same time, a very high ROAS might mean that you are not taking full advantage of that campaign. It means that the cost is too low and it is constraining revenue. Therefore, you might want to increase the spend in order to maximise revenue, potentially decreasing ROAS.
It is impossible to tell what is the perfect ROAS you should achieve. It really depends on your average basket size and how competitive your industry is.
As a general rule, I can say that ROAS should always stay above 1, in order to justify your ad investment. However, I might also say that ROAS should be at least 4. In fact, ad spend is generally only one of the many acquisition costs that your company faces.
Plus, don't forget that Google Ads is just a single step in the customer journey. Users might come through other paid channels, like Facebook Ads, Display Ads, Discovery Ads or affiliates.
Depending on the industry you might also be paying commissions to third-party partners. Therefore, you need to take all these costs in mind and make sure that the total cost doesn't exceed revenue. Making sure that every channel returns at least a ROAS of 4 is a good place to start from.
Depending on your bid strategy, you can change your Target ROAS and therefore bid more or less aggressively in the search auction. Otherwise, you can keep the ROAS the same but change the daily budget. This way your position in the auction will stay the same but you might show your ads more often.
It is a fine balance between your targets of spend, revenue and ROAS. Sometimes the business goal is to maximise revenue growth, at the cost of having a low ROAS. Sometimes the goal is to keep a constant ROAS and achieve profitability over time rather than revenue growth.
Whatever is your company's goal at any given time, you need to have full understanding and control over your ROAS. Plus, this is also the easiest way for managers to evaluate your work! Don't forget this. Ideally, you are a good PPC professional when you manage to generate more revenue at the same or at a lower cost than your competitors.
Go back to the TOP or ![]()
#4 CPC
Now, if coins had three sides, CPC (cost per click) would be the third one. Because Google Ads is ultimately based on a pay-per-click model (PPC), it all comes down to how much you pay for a click.
Cost per click tells you a lot about the level of competition and the general optimisation of a campaign. The lower the CPC, being the overall cost the same, the larger the traffic you bring to your website and the higher the chances to make a sale. The whole goal of a good PPC manager is to bring CPC down keeping traffic volume the same.
I know it might sound like a utopia, but this is actually possible! In fact, the Google Ads algorithm weights your bids with the Quality Score. The higher the Quality Score, the lower the CPC, being your bid the same. This means that, although you keep your bids the same, you might end up paying less per click if you manage to increase the Quality Score.
On top of that, the Quality Score has an impact on your ranking. Because of how the algorithm works, you might show your ads at a higher ranking than your competitors' and still pay less per click than them! This means that you will probably generate more traffic than them, at a lower cost. You see, this is not a utopia!
More traffic at a lower cost means more revenue at a lower cost. Guess what it means? a higher ROAS! This is why I was saying that ROAS is the coin itself. You can perform a Google Ads turnaround, where you might manage to do just that. You can manage to increase the Quality Score and therefore decrease the CPC, keeping the same, if not higher, volume of clicks. This brings in more revenue at a lower cost. The holy grail of any PPC advertiser.
Now you might be wondering why I haven't included the Quality Score among the most important metrics to look at. Well, although it is obviously a very important metric, it is not something I would check on a daily basis. I might look at it just on a weekly basis, or even monthly. This is because you don't necessarily have direct control over it. Plus, it can't be included in timeline charts and that is quite annoying!
The Quality Score is based on the quality of your keywords, ads, and landing pages. The landing page part sometimes is not under your direct control. Plus, it is quite slow to update. Changes in your ads or keywords might result in changes in the QS just after a few days. For this reason, I wouldn't be obsessed with it and I would take it just as a broad indicator over the quality of my account.
On the other hand, I would constantly check the CPC, which is, in fact, affected by the QS. So, looking at the CPC is basically looking at the QS as well. But the difference here is that you do have some direct control on the CPC. You can adjust your bids.
You can do that either through a manual or automated bid strategy. Ideally, you would like to see the CPC decreasing over time, or at the very least, going at the same pace as the revenue. You definitely don't want the CPC to go up and the revenue to go down.
Go back to the TOP or ![]()
#5 Search Impression Share
I mentioned a three-sided coin where the ROAS is the coin itself. Well, actually this weird PPC coin has four sides!
The Search Impression Share is the fourth side.
The Search Impression Share is expressed as a percentage. Generally speaking, the higher the percentage, the better. Google defines it as "the percentage of impressions that your ads receive compared to the total number of impressions that your ads could get."
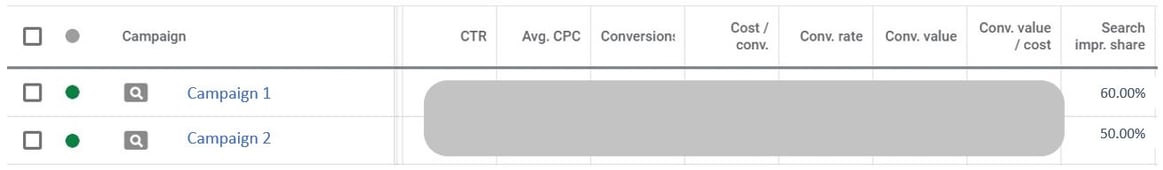
Impression share = actual impressions / total eligible impressions and again "Impression share is a good way to understand whether your ads might reach more people if you increase your bid or budget." Based on the screenshot above, the Search Impression Share is telling me that the ads belonging to "Campaign 1" showed up "only" 60% of the times they were eligible to.
Their eligibility is based on my keyword, location and audience targeting. This essentially means that I missed the opportunity to show up in the other 40% of cases. Who did show up instead? well, my competitors! So the lower your impression share, the higher your competitors'.
As you might know, the first page of the Google Search Engine can host up to 7 ads from 7 different businesses. If there are more than 7 advertisers participating in the same auction, well, some of them will be left out. In this case, I was left out 40% of the times.
There are two reasons why you might be left out.
- lack of budget
- low ranking (effectively lower than 7)
There are two metrics that can tell that.
- Search Lost IS (budget)
- Search Lost IS (rank)
IS = Impression Share
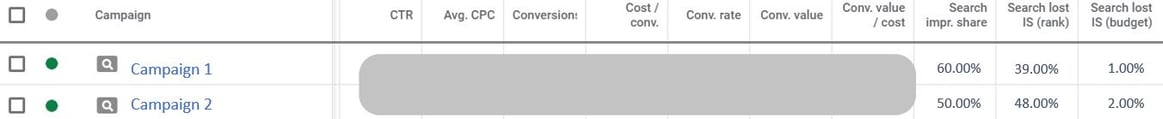
The screenshot above is telling me that out of the 40% of times that I was left out of the auction, 39% it was because of a low ranking. Just 1% of the times my budget stopped my ads to show up.
This means that my daily budget is fine and I don't need to increase it. However, I should probably increase my bids and/or my Quality Score. Now, the QS is calculated on a 1 to 10 scale.
Once you get to 10/10, the only way to improve your ranking is by increasing your bids. Whether I should actually increase the bids is debatable. It really depends on my ROAS target. In fact, if I increase the bids my ads would show up more often but, at the same time, chances are I would also get a higher CPC because of the higher ranking.
Will revenue increase because of the higher ranking? Not necessarily. Sometimes your ad rank doesn't have a direct impact on the bottom line.
In fact, many users might click on the top result just because it's the first one they find, not because they're actually interested in that product or service. Instead, if they scrolled down and, out of the many results they find, they click on yours, well, there are more chances they are actually interested in your offer.
Say I increase my bids and so my ranking. My CPC would go up. But revenue might not necessarily increase at the same pace. This would affect the ROAS, which would go down.
It is really up to me and to my business' strategy to decide whether I should increase the impression share. Either way, you need to be aware of this metric and keep it monitored closely.
Go back to the TOP or ![]()
Conclusion
These are the most basic, but at the same time the most important metrics you should look at when managing a Google Ads search account. However, these are not the only ones!
Depending on your campaign type, Shopping, Dynamic Search Ads, Video etc.. there are many more you need to be familiar with. All Google Ads metrics are somehow intertwined and affect each other. Therefore, always look at a variety of them and put things in perspective.
Never focus on one single metric to base your strategic decisions on.
By utilizing a Google Analytics reporting tool, advertisers can track and analyze key metrics such as Revenue, Cost, ROAS (Return on Ad Spend), CPC (Cost per Click), and Search Impression Share. These metrics play a vital role in understanding the effectiveness of ad campaigns, managing budgets, and improving overall performance.
Enjoyed this article? Check out Giacomo's Pro Tip on Implementing Custom Automated Text Ads.
Go back to the TOP or ![]()