If you're reading this, then you're probably familiar with Performance Max campaigns. This fully automated Google Ads campaign type promises to drive conversions, pairing intelligent machine learning with an array of Google’s channels and inventory.
Let's face it, even the most advanced technology has its limitations. As powerful as Performance Max campaigns are when it comes to driving conversions, there’s always been an air of mystery around PMax campaign reporting.
But fear not, my friend, because in this article we're going to show you how best to analyze your PMax campaign data, where to focus your reporting efforts and how to uncover insights that will ultimately boost performance.
About Google Performance Max reports
With Performance Max, advertisers can access all Google Ads inventory from a single campaign, using a goal-based approach. Google Performance Max reporting refers to the ability to track and analyze performance metrics of Performance Max campaigns in Google Ads.
The ads performance report features in Google Ads provide valuable insights into the effectiveness of Performance Max campaigns. For example, asset reporting allows advertisers to understand the impact of different advertisements on campaign performance, the Performance Max location report provides data on the effect of your Performance Max campaign in different locations, and there are many more report types you can take advantage of.
A Performance Max campaign, no matter how innovative and different it is, is still a Google Ads campaign. As a result, all the deliberations relevant to Google Analytics and Google Ads are also applicable to Performance Max campaigns.
Important!
When viewing reports for Performance Max campaigns, it's important to keep in mind that certain filters may not work correctly. Filters like Ad group, Campaign terms, and Campaign content are not compatible with Performance Max campaigns and can cause inaccurate stats to be displayed. To avoid any confusion, it's recommended to remove these filters before attempting to view a report for a Performance Max campaign. This best practice ensures that you get accurate and reliable data for your analysis.
2 Reasons why PMax reporting matters
Performance Max is a real innovation - isn't it better to just let Google do its thing? Well, yes and no. Yes, reaps the benefits from PMax campaign automation. But at the same time, no, reporting still matters.
1. Optimization
The main reason is that accurate and comprehensive reporting can provide valuable insights into campaign performance. This insight can then be used to make adjustments that improve efficiency and ROI. So, it’s all about getting insight that will improve performance. And even though Pmax campaigns are automated, giving your campaigns as much steer as possible will speed up learning and enhance results.
2. Communication
Ensure reporting is clear and easy for key stakeholders to understand. By providing clear and actionable reporting, everyone involved will understand the impact your PMax campaigns have on the business. This will probably make your life easier as a PPC manager, as well as make budget allocation, resource allocation, and the future of your Google Ads account as bright as possible.
Google Analytics Reporting vs Google Ads Reporting
Performance Max campaigns can also be integrated with Google Analytics and using it can help you gain deep insights into their user behavior, demographics, and conversion tracking. GA offers a comprehensive view of website traffic from all sources, however, when it comes to PMax reporting, everything has changed for the better in recent years.
Using Google Ads reporting for Performance Max campaigns now takes into account all of the touchpoints that a user has with your ads. This includes channels and devices, search terms and Listing Group data. You get a more complete picture of how users are interacting with your ads and where they're ultimately converting. Also, since GA is more concerned with last click attribution, GA reporting lacks the big picture.
We would suggest using Google Ads to report on your PMax campaigns but also continue using Google Analytics alongside Google Ads to make measuring and optimizing more robust. You know what they say, two heads are better than one.
To make measuring and optimizing unbiased we would suggest you to run PMax campaign performance reporting in Feed Analytics. It will take into consideration both the metrics that show up on your Google Analytics and Google Ads account. You know what they say, two heads are better than one.
Guide to Performance Max reporting
Now for the juicy part. Let’s take a look at the data and reporting options that are available in a Performance Max campaign and at the assets group level, including in the insights section. And more importantly: how do you audit performance max campaign and how you can use this data to improve your campaign's performance?
As an introduction, when using the Performance Max campaign reports, it's best to go to the "Campaigns" tab. This way, you can avoid seeing multiple rows of data that could be confusing because the data can be split across them when using the Campaign, Campaign ID, or Campaign ID dimensions. The "Campaigns" tab works as intended for Performance Max data and can help you analyze your campaign more easily. So, whenever you need to look at the Performance Max campaign report, just head over to the Campaigns tab for a clearer view of your data.
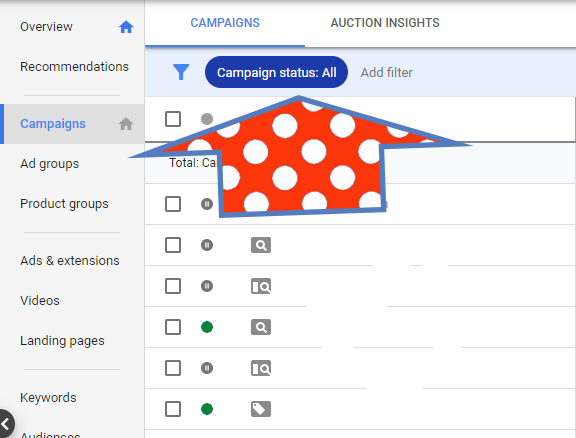
Campaign Tab | Google Ads, Source
All clear? Let’s dive in!
Asset reporting in Performance Max
Goal: to get a general overview over your assets.
The asset report provides a comprehensive list of all the assets utilized in your Performance Max campaign. With this report, you can easily compare the performance of different assets and gain valuable insights. This report can include information such as: the asset type (e.g., description, headline, image, logo, YouTube video), performance rankings of assets within the same type (e.g., low, good, or best performers), and other relevant data.
As you analyze the data over time, you'll be empowered to make strategic decisions regarding your assets. You can determine which assets to rotate, remove, or enhance, ensuring that your campaign is optimized for success. By focusing on assets that deliver better performance, you can drive more impactful results.
Additionally, the asset report helps you identify the right time to create new assets that are based on the success of similar ones, further enhancing your campaign's performance.
This section isn’t the most granular or detailed but it can spark some optimization ideas.
To access your asset report, follow these simple steps:
- Click on the Campaigns
icon.
- From the section menu, go to the "Campaigns" dropdown.
- Choose the desired Performance Max campaign from the list.
- You will be directed to the overview page of the selected campaign.
- On the left side of the page menu, click on Asset groups.
- Look for the card representing the asset group you want to see and click on View details.
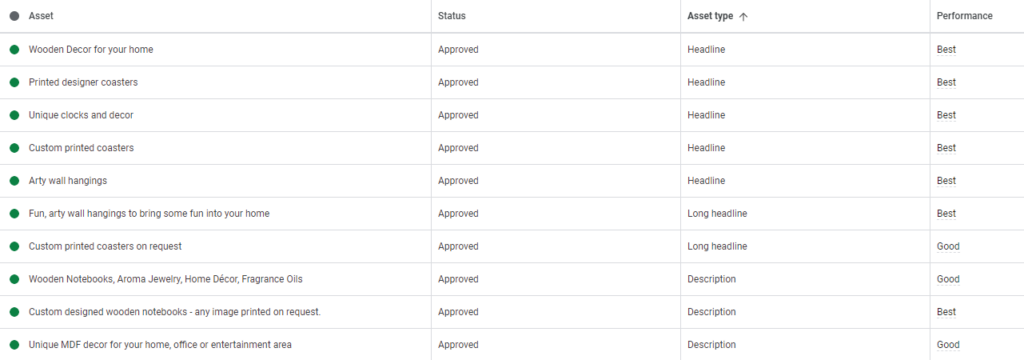
Performance Max asset report | Google Ads
Each asset is assigned a ranking of low, good, or best. The "low" ranking indicates that the asset is underperforming compared to others of the same kind across all properties. On the other hand, "good" assets meet an acceptable performance level within their asset type.
Assets labeled as "best" are the highest-performing ones among all assets of the same type, either on a single property or across multiple properties.
In case you come across an asset with a "pending" label, it means that Google is still collecting data and hasn't assigned a ranking yet.
By evaluating the rankings in the asset report, you can easily pinpoint the assets that deliver the best results. We would advise taking out all of the assets with ‘low’ performance and replace them with more of what’s working best.
Asset group Performance Max reporting
Goal: to assess the performance of each asset group.
Asset group reporting for Performance Max (PMax) in Google Ads provides valuable insights into the performance of your ads and assets within different asset groups. By analyzing this data, you can optimize your campaigns and drive better result
Performance Max asset group report | Google Ads
Asset group reporting allows you to understand how each asset group contributes to the overall performance of your campaign. You can access this reporting in the Google Ads interface by navigating to the "Campaigns" icon .
- From the section menu, select the Campaigns dropdown.
- Click on the Campaigns option.
- On the "Campaigns" page, choose the specific Performance Max campaign you want to view.
- Go to the Asset groups tab.
- In the top right corner, switch the page view from "Summary" to "Table". Note that the table will display the default metrics only (for example conversion rate).
- If you want to view additional columns, click the Columns button and then select Modify columns. You can explore the available metrics and apply them to the report as columns.
In the asset group reporting, you can review key performance indicators like impressions, clicks, conversions, and conversion rates for each asset group. This information enables you to identify which assets are most effective and resonate with your target audience.
The default metrics are the following:
- Conversions: When someone interacts with your ad or free product listing and takes an action deemed valuable to your business, it's counted as a conversion. By keeping track of your conversions, you gain valuable insights into how many customers are engaging with your ads that consist of assets from your Performance Max asset group.
- Conversion value: If you measure conversion value along with your conversion goals, you can accurately assess and optimize the true impact of your ad campaigns. This allows you to make data-driven decisions and allocate resources more effectively.
- Conversion rate: To understand the effectiveness of your ads, you can analyze your conversion rate. This rate represents the average number of conversions per ad interaction and is displayed as a percentage. By monitoring your conversion rate, you can ensure that the highest-performing assets in your asset group continue to be showcased.
- Cost per Conversion: It reveals how much each conversion costs on average. You can calculate this by dividing your total cost by the number of conversions in your "Conversions" column. By evaluating your cost per conversion, you can ensure that your investment is generating favorable results and optimize your asset group accordingly.
With this data, you can make data-driven decisions to optimize your campaigns. For example, if you notice that a particular asset group consistently performs better than others, you can allocate more budget or resources to that group. Conversely, if certain asset groups are underperforming, you may consider making changes to improve their performance or replace them with new assets.
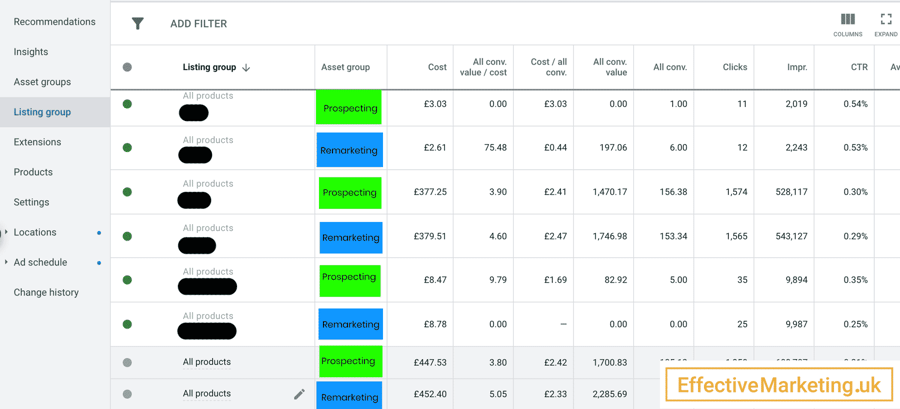
Performance Max Listing groups report
If you want to explore your asset groups' performance even more and have added a product feed to your PMax campaign, then you're in luck! The Listing group tab enables you to view asset group performance.
This data applies only to Shopping ads. The listing group report can be useful if you've segmented your product catalog to meet a particular strategy - then you can understand your Shopping ad traffic trends better by examining the performance of each asset group.
It's easy to view the listing group's performance by asset group:
- Click on one of your Performance Max campaigns.
- Navigate to the left-hand menu and select the Listing Group.
- You can now see a report that presents product performance by asset group.
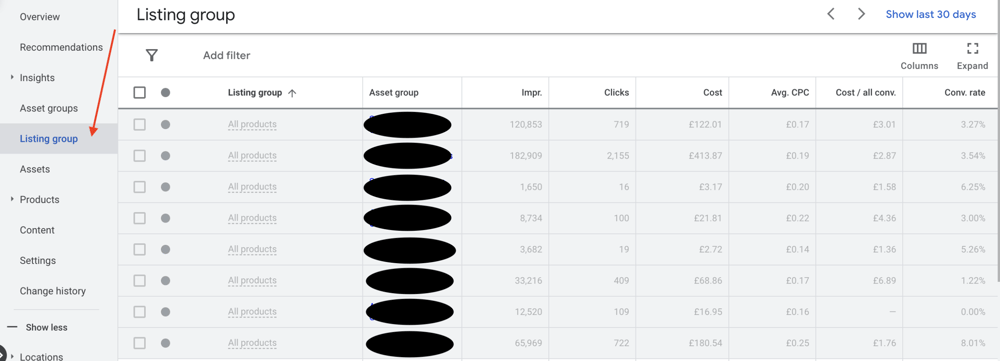
Performance Max listing group report | Google Ads
Use this data to optimize your campaign and approach this in a similar way to standard Shopping optimization.
For example, further organize your products or services using more groups for better management based on performance. Or exclude underperforming products by Brand, Product ID, Category, Custom Labels, etc. to reduce waste. You could also better tailor asset groups to products and services.
Performance Max combinations report
Goal: to identify top asset combinations.
The Combinations report for your Performance Max campaigns is an essential tool that helps you identify the top-performing asset combinations for each asset group. Not only that, but it also enables you to visualize how your creatives appear in your ads by showcasing a range of the best-performing asset combinations from each assets group.
By categorizing asset combinations by types like text, images, and videos, and listing the six best combos in each category, you can easily identify and focus on your top-performing ads. With this report, you can preview how your asset combinations will appear on various networks like Search, Display, YouTube, and Gmail.
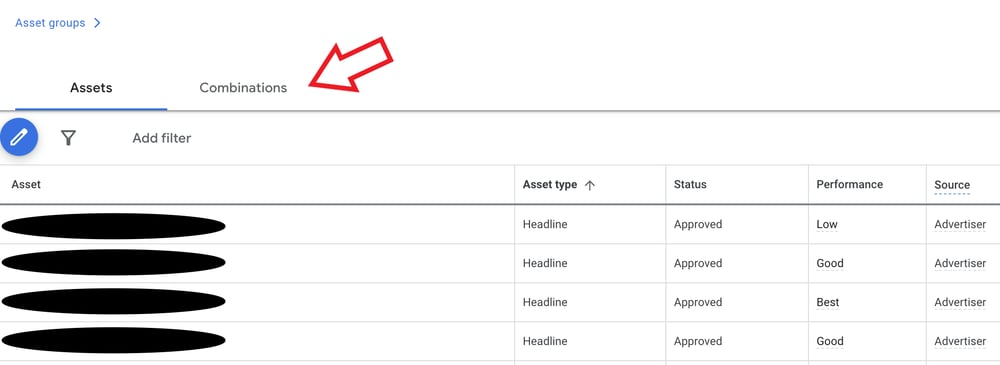
Performance Max combination report | Google Ads
To access the Combinations report in your Performance Max campaign, simply follow these steps:
- Go to your Google Ads account and click on the Campaigns
icon.
- Click on the Campaigns dropdown from the section menu.
- Select the Campaigns option.
- Choose the Performance Max campaign that you want to view on the "Campaigns" page.
- Click on the Asset groups tab.
- From the asset group card, select View Details.
- On the "Asset report" page, click on the Combinations tab.
- Here you'll find 18 tiles, each displaying the top 6 combinations for text, image and video assets, ranked by performance.
- To preview your asset combinations in different networks, click on the Preview Ads button on the tiles.
Google Performance Max Insights tab
Goal: for improvements in reporting transparency,
While it's widely known that Performance Max may have limited reporting transparency, the Insights tab surprisingly offers a bit of valuable information.
Similar to the Asset reporting section, the insights section gives an understanding of your campaign's performance and includes some of the standard click and conversion metrics. It’s helpful for getting a quick overview into performance, which is handy.
You can get information on audiences and themes that are relevant to your products or services, based on search trends, demand forecasts, and consumer interests. Additionally, the tab allows you to access performance trends, view week-over-week or month-over-month data, and gather useful information on overall campaign performance
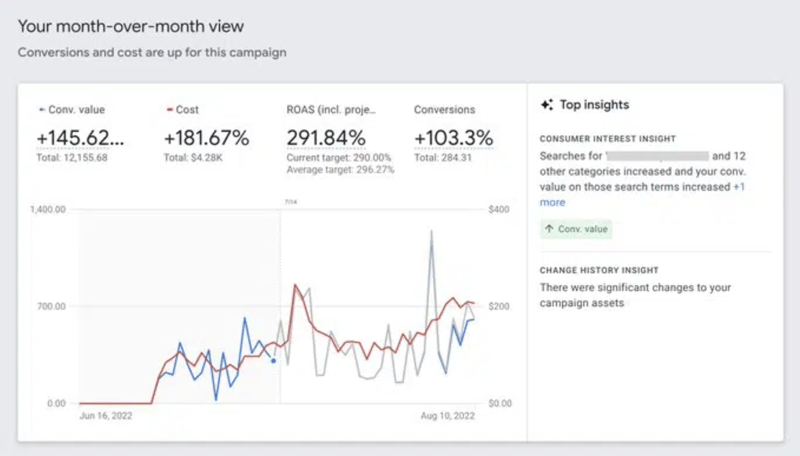
Performance Max Insights report | Google Ads
After a few days or weeks of running your campaign (depending on your budget), you'll begin to notice the most successful "Search categories" and "Audience segments." You can click into them to go a little deeper. You may also find some recommendations highlighted here that you may or may not want to apply.
Search Term reporting within Insights Tab
Search terms reports can be found within the Google ad Insights section and they show you the terms that triggered your ads. We find this section particularly useful.
Search terms are grouped into themes (search categories) and you can expand the themes to get more insight. You can see this data to identify high-performing keywords and searches as well as to find negative keywords that may need excluding from your campaign.
This report will address two vital questions for you:
- Is Performance Max (PMax) prioritizing brand or non-brand searches?
- Is PMax uncovering new searches or targeting the same ones that your current search campaigns already cover?
In this specific case, the highest-performing search category consisted of already successful search terms. The second category contained brand terms, which also performed well. However, the third category was one that we hadn't specifically targeted before - that means that it presented a significant opportunity for growth for our online business.
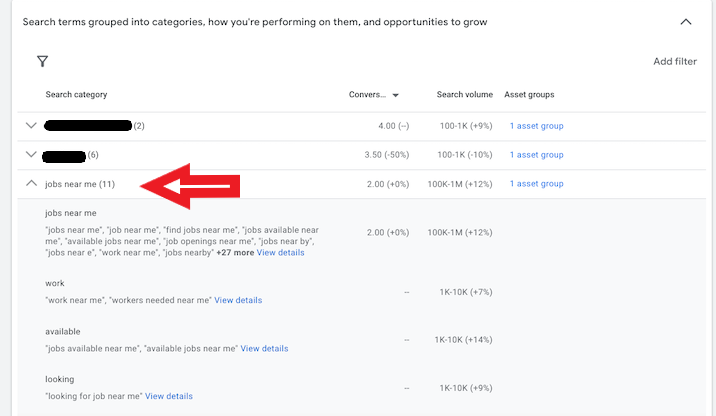
Performance Max SearchTerms report | Google Ads
TIP
You could experiment with top performing search terms by adding them to a traditional Search campaign. Though, if they are already doing a great job as part of a PMax campaign, this may not be needed.
Check out this article on how to add negative keywords to your Performance Max campaigns.
Also, if you’re noticing branded searches appear in the search terms report, follow these 5 Steps to Deal with Branded Searches in PMax Campaigns.
Audience segments reporting within Insights Tab
The reporting on audience segments in the Insights tab will reveal the specific Google audiences that your converting users belong to. This feature is incredibly valuable for assessing whether the Video/Display segment of your Performance Max campaign is effectively reaching your target audience. Let's take an example to illustrate this: in this case, we found that two in-market audience segments were responsible for a significant 60% of conversions.
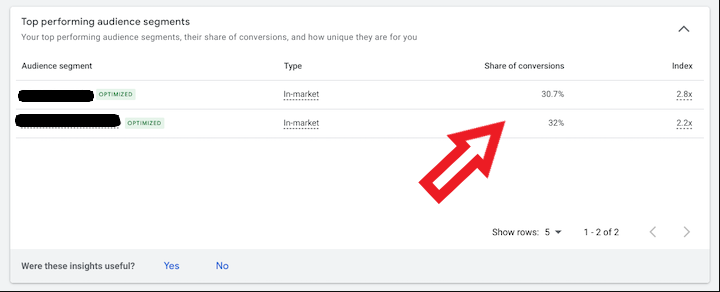
Performance Max Audience report | Google Ads
Performance Max traffic by device reporting
Goal: to know the performance of your ads on different devices.
Tracking and analyzing the performance of your ad campaigns across different devices is also important for optimizing your advertising strategy. With Performance Max, you can generate reports that provide Google Ads insights into how your campaigns are performing on various devices.
By leveraging the reporting feature, you can gain a comprehensive understanding of how your ads are resonating with users on desktops, mobile devices, and tablets. This device-specific data allows you to make data-driven decisions to optimize your campaigns and allocate your resources effectively.
To access device-specific reporting in Performance Max, follow these simple steps:
- Sign in to your Google Ads account.
- Click on the Campaigns
- In the section menu, select Performance Max.
- Choose the Performance Max campaign you want to analyze.
- Navigate to the reporting section or tab within the campaign.
- Look for the Segment tab to filter the report by device.
- Select the specific device category you wish to focus on, such as desktop, mobile, or tablet.
Once you've applied the device filter, the report will display valuable insights, including impressions, clicks, conversions, conversion rates, and other relevant metrics specific to the chosen device category.
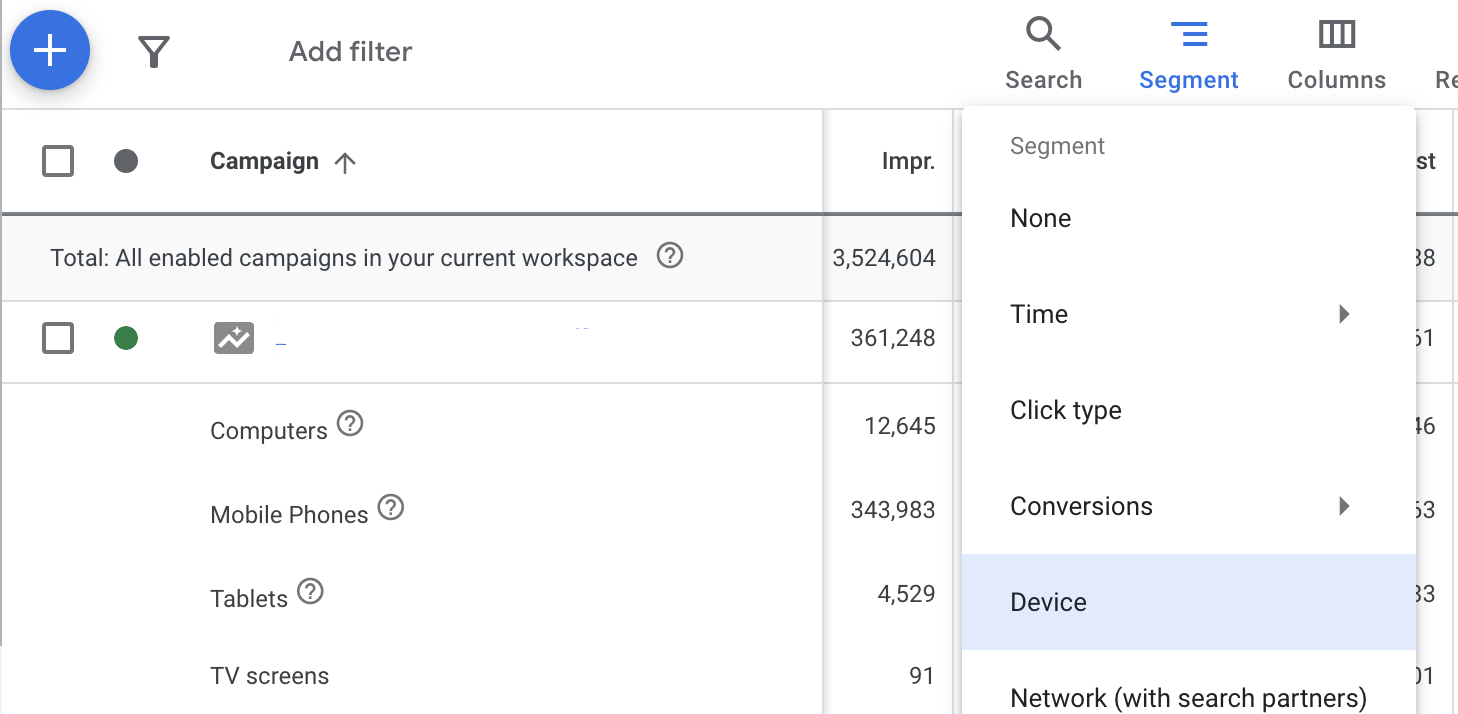
Performance Max Device report | Google Ads
This could unlock insight into how different devices impact performance and where optimization efforts are needed.
Performance Max location and ad schedule reports
Goal: to find out which users convert in which countries and at what time.
Both of these sections have carried over from standard Google Ads campaigns, which means you can use them in the same way. This also applies to any Google Ads campaign report including location and ad schedules reports..
Dive into location performance to learn how it differs from place to place. There’s potential to exclude places that are underperforming, or isolate the best performing places to allocate more budget where your customers actually are.
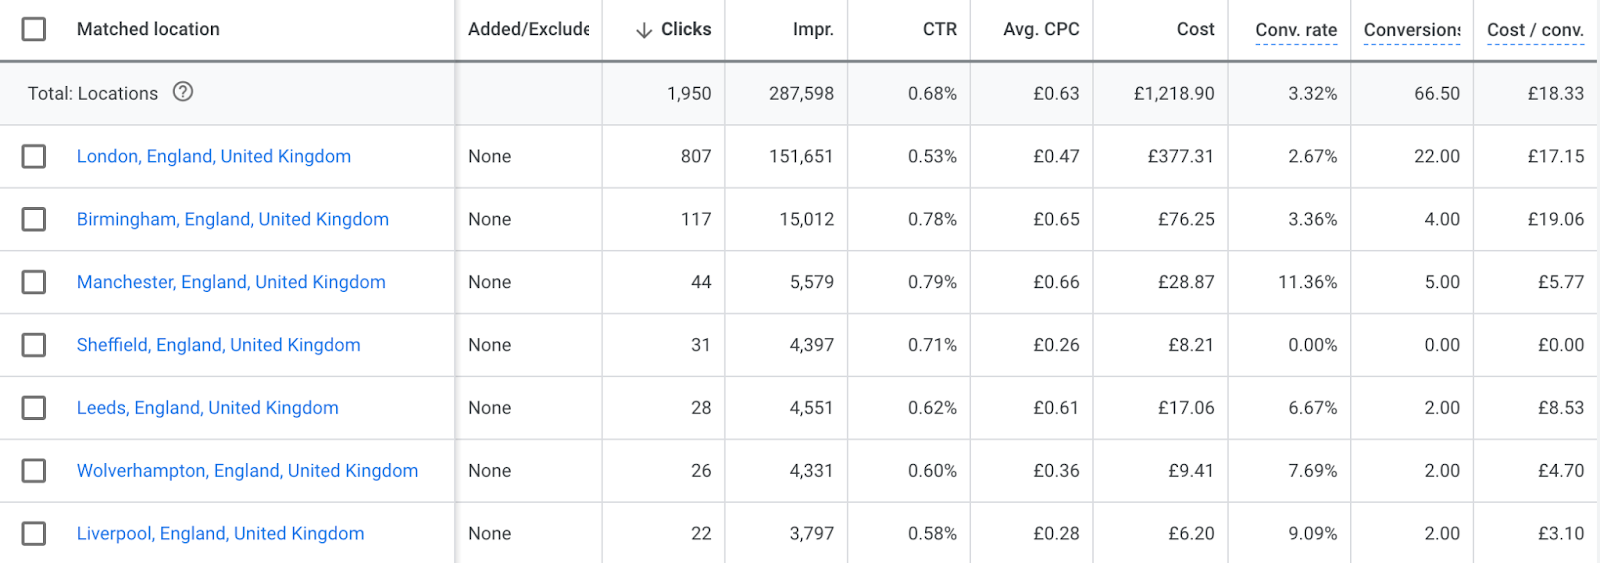
Performance Max location report | Google Ads
The same goes for Ad Schedule. Look for any time of day or day of week insights that can be used to optimize your campaign.
Optimization tip - if your ad schedule is 24/7, 7 days a week, still add an Ad Schedule that includes all days and split the day up into sections, as seen in the screenshot below (midnight - 7am, 7am - midday, midday - 6pm, 6pm - midnight). Doing this will provide you with richer data into time of day performance which could help you optimize your campaign once enough data has been collected. Without doing this, no data will be shown here.
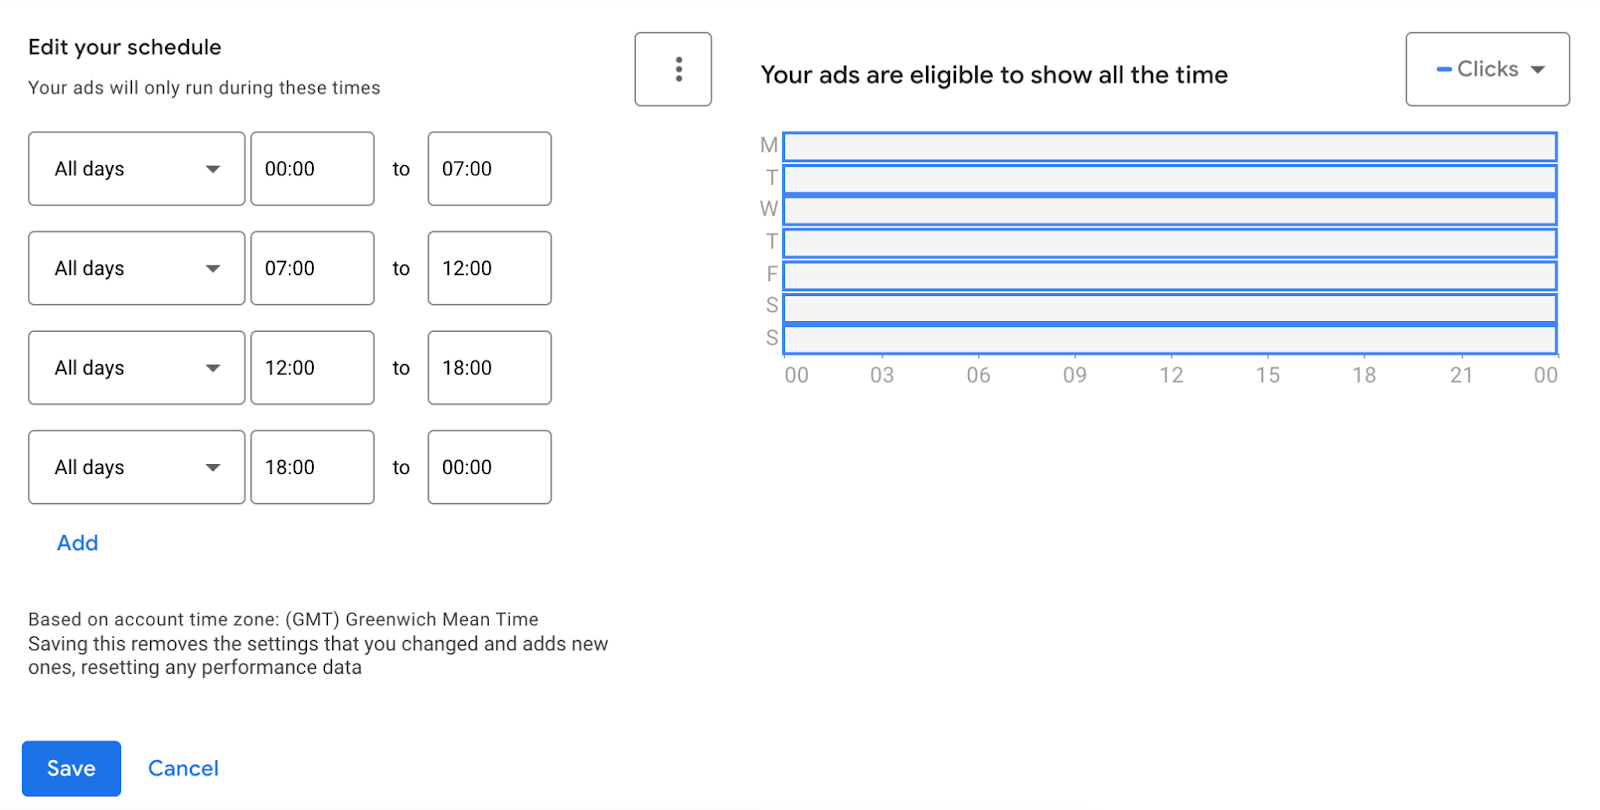
Performance Max ad schedule report | Google Ads
Performance Max placement report
Goal: to identify the general placements on Google's channels where your ads are appearing
With Performance Max campaigns, you can showcase and promote all your products and services across all Google network channels.
Unfortunately Performance Max placement reports are not the easiest to find and a bit of a hassle, but you can use a Google Ads custom report to pull out data on Performance Max placements. The information in the destinations report doesn't include results from all channels, but it definitely gets you closer to understanding where your traffic is coming from.
What you get from Placement Report are 2 categories:
- Google Owned & Operated: This category refers to all sites owned and operated by Google, including YouTube, Gmail, Play, and Discover. The placement report includes this category to combine all impressions served on Google-owned properties.
- Anonymous.google placement: This placement refers to all ad placements that publishers configure to keep their site name confidential from advertisers.
Search is not included in placement reporting as it’s not considered a placement.
He’re how you can download your predefined placement report:
- Navigate to your Google Ads account and click on the Campaigns
- Select the Insights and reports drop-down menu.
- Click on the Report editor option.
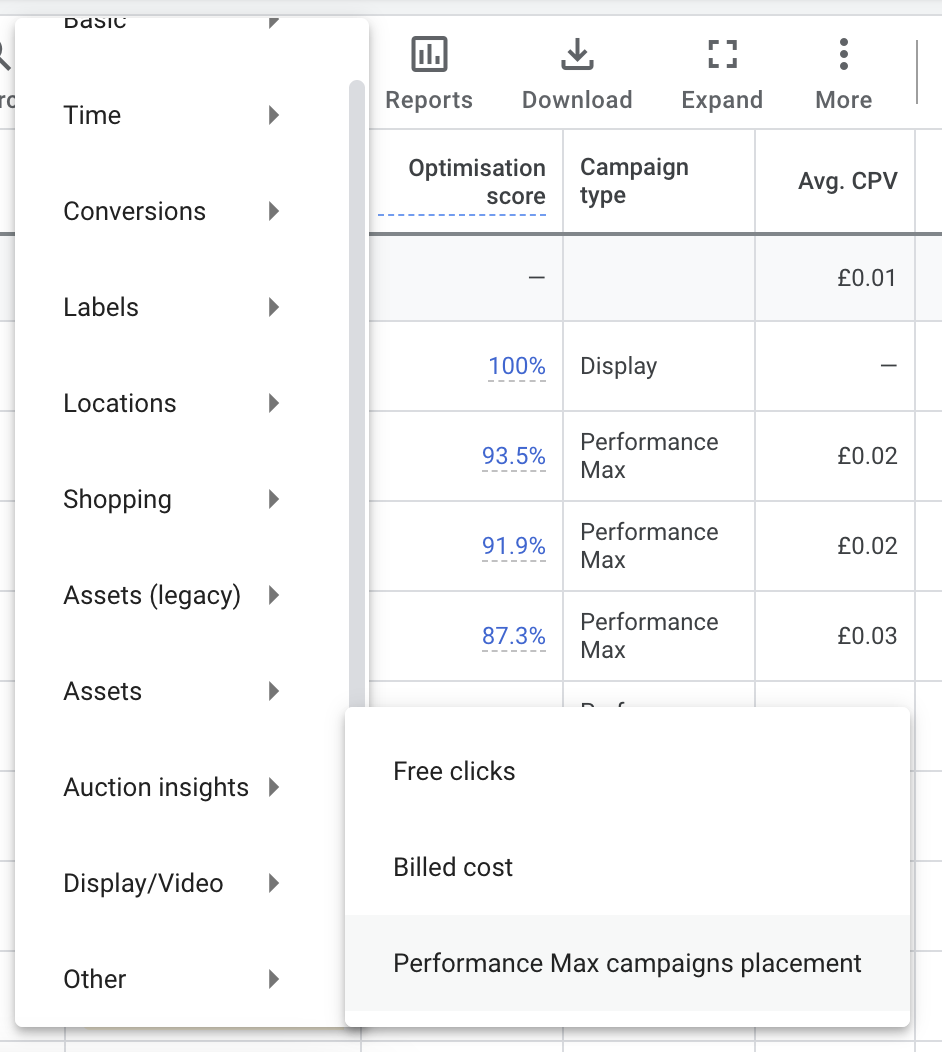
- From the drop-down menu, choose Predefined reports (Dimensions).
- Select Other from the list of options.
- Click on the Performance Max campaigns placement report.
- Refine your report by adding filters of your choice using the filter icon
and filter types.
- When you're ready, download your report by clicking on the Download button and choosing your preferred file type.
Performance Max placement report | Google Ads
And he’re how you can build a custom placement report:
- Access your account and click on the Campaigns
- Locate the Insights and reports drop-down menu and click on it.
- Select Report editor from the options listed.
- Identify the plus icon next to "Custom" and click on it to expand the options. Then, choose Table.
- In the "Attributes" section, find the Performance Max placement option or simply enter "Performance Max placement" in the search bar. This selection will appear in the "Row" section of your report.
- In the "Performance" section, search for and select Impr. or enter "Impr." in the search bar. This will be displayed in the "Column" section of the report.
- To refine your report, you have the option to add filters by clicking on the filter icon and selecting the desired filter types.
- Once your report is ready, click on the Download button and choose the file type you prefer to download the report.
Performance Max budget & bidding strategy report
Goal: to help identify areas where changes can be made to the budget and bidding strategy.
Managing your Performance Max campaigns can be challenging, especially when you're considering adjusting your bidding strategies and budgets without impression share metrics. But don't worry, we're here to help!
To be clear, this isn't exactly a results report, but it offers a way to think about modifying bidding strategies and budgets.
The 'Bid & Budget Report' available at the campaign level is a good tool to help you identify potential adjustments and estimate their impact with the “Campaign Target Simulator.”
It's crucial to keep a close eye on budget constraints, particularly after launching new campaigns, to ensure that you don't miss out on potential conversions.
To access the Campaign Target Simulator, simply hover over the icon under the budget column while viewing the list of your campaigns in your Google Ads interface. Depending on your bid strategy, this simulation feature can combine potential targets with your budget to indicate the likely effects of any proposed adjustments
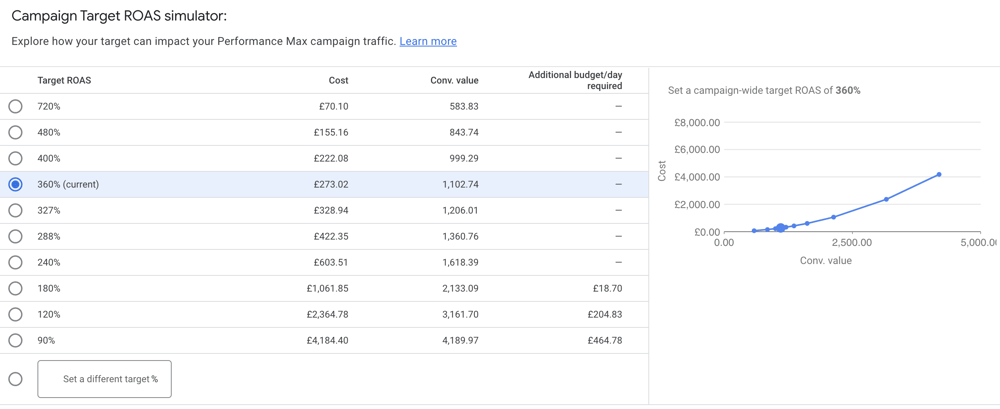
Campaign Target ROAS simulator | Google Ads
When it comes to adjusting your ROAS target, it's important to understand the potential impact. Increasing your ROAS target can sometimes lead to fewer clicks, resulting in fewer conversions and reduced revenue. On the other hand, if you relax your bid strategy constraints by reducing your ROAS target, you might observe an increase in traffic and conversions, but it may also come with a higher cost.
Performance Max auction insights
Goal: to know how your Performance Max campaigns are performing in comparison to the competitors.
It’s important to understand how your ads are performing compared to other advertisers who are competing in the same auctions as you. This is another report carried over from standard Google Ads campaigns, allowing you to identify who your top competitors in Search or Shopping results are, and possible areas for improvement.
Within this report, you have the option to finely adjust date ranges to observe how your Search Impression Share fluctuates during specific time frames. This is an essential aspect of Performance Max diagnostics as adjustments to Assets may impact your ad relevance for significant search queries.
By using Auction Insights, you can gain valuable insights into your competition. It enables you to adjust your Ads, bidding strategy, and budgets for optimal performance.
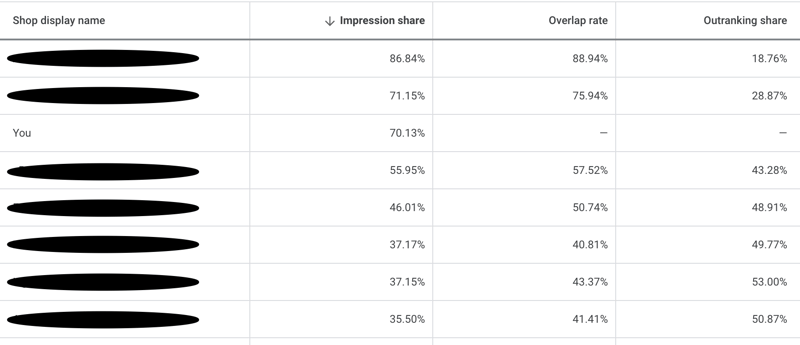
Performance Max auction report | Google Ads
Performance Max landing page reporting
Goal: to compare results of different landing pages linked to your campaign.
Back when the platform was first introduced, the only way to report on landing pages was by using Google Analytics. As of now, there isn't a designated landing page report obtainable in any campaign, but there is a workaround you can use to create a custom report in the Google Ads reports section.
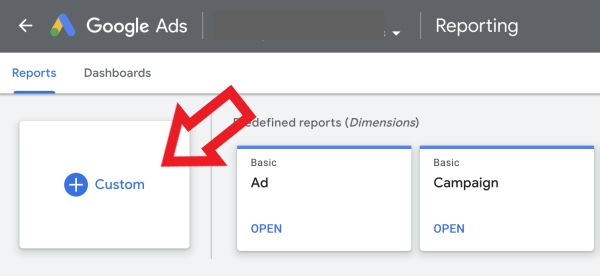
Performance Max custom reports | Google Ads
- To create a Google Ads custom report, navigate to the reports section in Google Ads and click the button to get started.
- Include two row headings: Campaign and Landing Page.
- Insert the column metrics like clicks, impressions, CTR, conversion rate, and revenue.
- To narrow down the report to display landing page data for specific Performance Max Campaign(s), access Filter at the upper right corner.
- Choose your desired Performance Max campaign, then click Apply.
- The resulting display will present metrics for each landing page linked to the chosen campaign.
It's crucial to recognize that these metrics encompass all ad formats, leading to varying performance based on the landing page PMax uses for each ad.
Should you identify problematic pages, excluding them as landing pages from PMax will enhance performance. This data can guide you in adding pages to the landing page exclusions within your Performance Max campaign settings.
Read also: How to Optimize PMax Campaign with Final URL Expansion?
Performance Max campaign reporting script
Goal: to see the performance of your ads in different Google channels.
Have you considered running a reporting script on your Performance Max campaign to get even more insight? A data genius from AgencySavvy has developed a script that will provide you with a Search VS Display VS Shopping VS Video breakdown of performance.
It’s a little more advanced, but if it is something you are able to implement it’s worth the effort that’s involved. Adding this script will provide a clear understanding of where your Performance Max spend is going, and the results from Search, Display, Video and Shopping.
This script will feed a spreadsheet with a 30 day window and provide you with plenty of data and insight to drill down into:
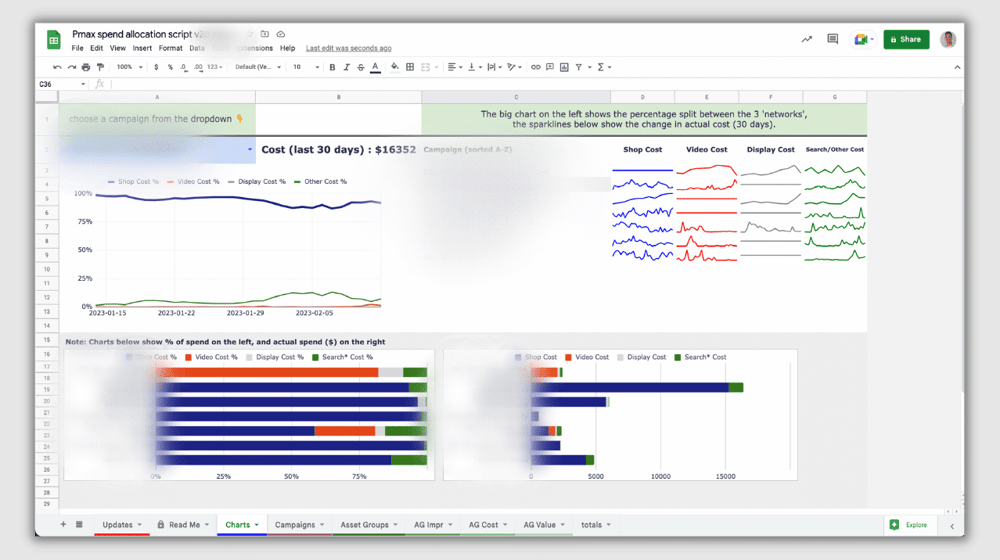
Performance Max reporting script | Github
To implement this script, visit this GitHub page. There's a really clear and informative video that walks through all of the steps involved in getting this set up.
Limitations to Performance Max reporting
The main issue with PMax campaign reporting is how it’s difficult for advertisers to get a complete picture of PMax campaign performance, especially compared to the very transparent and hands on functionality of traditional Google Ads campaigns.
Here are some of the main limitations to PMax campaign reporting.
- Performance Max data's limited granularity
Performance Max campaigns have fewer reporting options compared to other Google Ads campaigns, making it challenging to analyze performance in familiar ways. The absence of ad groups and keywords associated with Performance Max campaigns complicates data segmentation and reporting.
Performance Max campaigns lack detailed data on audience behavior, ad placement control, and budget allocation. Advertisers may need to rely on machine learning optimization without sufficient data or control over their ad spend allocation.
- Google Analytics complicated navigation
Analyzing website data generated by Performance Max campaigns requires careful navigation. The data falls under a separate grouping called "Cross Channel" and may not align with default channel groupings. Dimension filters incompatible with Performance Max campaigns can also cause incorrect data display in Google Analytics.
- Non-traditional analysis don’t work
Traditional analysis tactics may not be effective or feasible for Performance Max campaigns due to real-time optimization and limited control over variables such as ad placements and creative elements. Customizing reports, running A/B tests, and granular audience targeting are restricted, impacting campaign analysis and optimization.
- Cross-channel reporting difficulties
It’s tricky to understand how your Performance Max campaigns perform across all of Google’s channels. For example, it would be really helpful to know the best and worst performing channels and where spend is being allocated. It would also be helpful to know how these channels interact with one another, as well as other online channels.
By understanding what the limitations to Performance MaX reporting are, it’ll be easier to find solutions and work-arounds that can work for you.
Summary
Performance Max campaigns have been continuously evolving since they were launched back in 2021. On the whole, updates and new releases for these campaigns are welcomed with open arms, especially when they give advertisers more insights and more control.
Right now, there are a lot of useful PMax reports you can get interesting ads performance insights from and a bunch of workarounds you can use to get additional data.
Let's all learn and share your experience with Performance Max in the comments section below.
Read also other posts related to Performance Max:
Performance Max vs Discovery Ads: How are they different?
12 Performance Max Best Practices [CHECKLIST]