Google Shopping can play a significant role in generating online sales and revenue. Setting up your shopping campaigns is the all-important first step, however, Google Shopping monitoring is essential to boost performance and to ensure your campaigns go that extra mile.
Monitoring of shopping campaigns is often overlooked by advertisers who adopt a more passive approach to management and monitoring, which could be holding back performance.
To boost campaigns, include monitoring in your strategy as an ongoing process, ensuring campaign management is consistent and streamlined.
- Monitoring is important for understanding campaign health, gaining valuable insights, identifying trends and keeping an eye on competitor activity.
- Begin monitoring by regularly keeping track of what competitors are up to, using the numerous tools that are available to advertisers.
- Ensure account and campaign tracking is set up correctly, accurately recording conversion data within your ad account.
- Monitoring key performance metrics, such as conversion rate, average order value and ROAS. Elevate this by also looking at profit-margin-based metrics.
- Use automation to assist with Google Shopping monitoring and help you achieve a competitive advantage.
Why is Google Shopping monitoring important?
Google Shopping monitoring is the process of monitoring campaign configuration, feed health, performance metrics, insights and competitors. Here are 4 key reasons why it is important and how it can boost performance.
1. Campaign health
Daily monitoring is vital for understanding campaign health and although doing it every day is advised, not every element of monitoring needs to be in-depth each day. It could be as simple as checking in on key metrics so as to have the knowledge and confidence that performance is on track.
2. Gain valuable insights
Monitoring Shopping performance allows you to gain valuable insights into performance and how effective the campaigns are at hitting business objectives. It’s about going one step further than just checking in on campaign health.
Not only is this necessary in order to justify ad spend and understand profitability, but it’s also important for optimization work and improving performance.
3. Identify trends and patterns
Google Shopping monitoring uncovers important trends and patterns that can help inform strategy. For example, the performance of certain products may differ at varying times of the year or month and identifying this means the campaign can be optimized to reflect this.
Identifying trends helps advertisers swiftly make adjustments to their campaigns to ensure ads reach the right audience at the right time.
4. Competitive advantage
Google Shopping ads monitoring can help you achieve and maintain a competitive advantage by knowing exactly what your competitors are up to and what their shopping strategy is. To prevent them from outmaneuvering you, you must be aware of competitor campaigns and ads, the products they are promoting, their pricing strategy and their keywords.
5 Ways Google Shopping Monitoring Can Boost Performance
Let’s run through 5 ways monitoring your Shopping campaigns can boost their performance. From competitor analysis to tracking, key metrics to monitoring and how automation can be used to enhance monitoring.

1: Monitor Google Shopping competitors
Every marketer should have awareness of what their competition is up to, or better still, aspire to be ahead of the competition. This begins with competitor monitoring. Getting any sort of insight into competitors will help businesses refine their own approach and secure a competitive edge.
For Google Shopping, closely observe key aspects of your competitor campaigns such as ad placements, messaging and pricing strategies. It’s also a good idea to explore some of the competitive intelligence tools available to advertisers.
Let’s take a look at some practical ways advertisers can monitor Google Shopping competitors.
Check the Auction Insights report
Check auction insights to see who you are competing with in the auction and how you compare to competitors in terms of visibility and competitiveness. This should also provide you with ideas and opportunities for how you can improve.
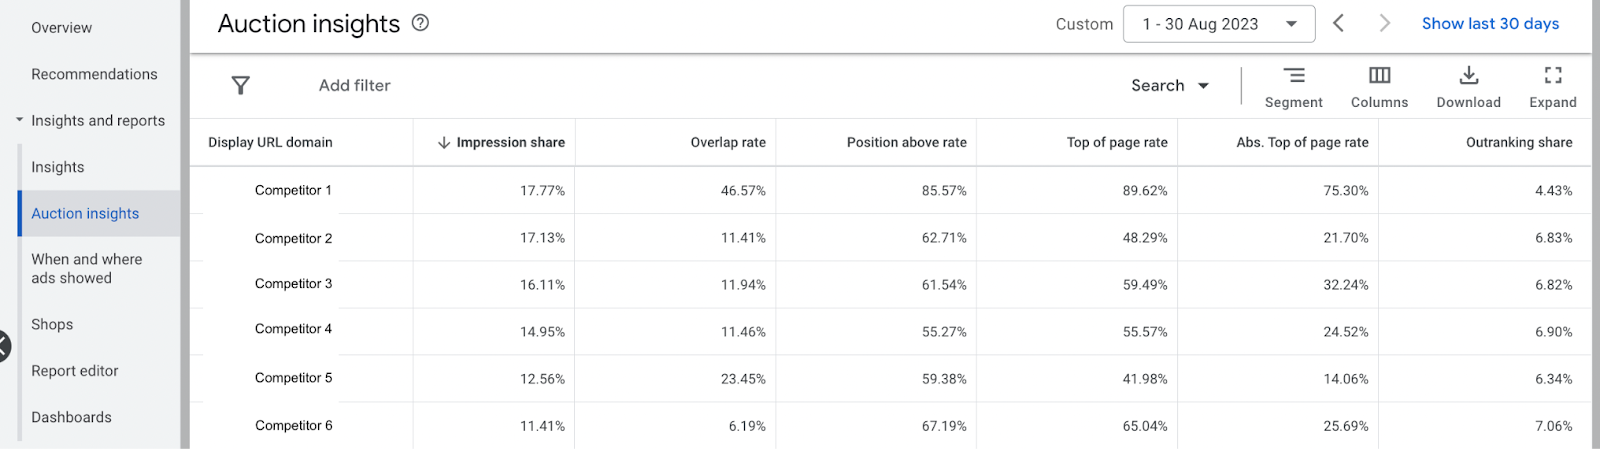
Study each of the metrics available to understand your impression share, how much overlap there is with your competitors and who has the highest ‘position above’ and ‘top-of-page’ rate.
Monitor Google Shopping ads
Regularly analyzing competitor ads in Google Shopping search results is another good practice. Observe ad placements, especially since Performance Max has been disrupting traditional shopping placements as well as the ads themselves.
Pay attention to ad copy and ad content, as well as the keywords your competitors are using, which can uncover messaging strategies and who their targeted audience is.

Some things to bear in mind are product titles, pricing strategy, review extensions, shipping information and other attributes included in a shopping ad.
If your competition has reviews in their ads, it would be a good idea to collect reviews so you can compete with them. Or if competitors charge $3.99 for delivery, being able to offer free delivery or faster shipping could provide a competitive edge.
Check out our 10 rules to optimize your Google Shopping titles, from the use of keywords, categories, and brand and product details, to character length and ongoing testing strategies, these rules will help improve your competitiveness.
Use Competitive Intelligence Tools
Consider using competitive intelligence tools specifically designed for Google Shopping. These tools can provide in-depth information about competitor performance, keywords, and ad placements.
As well as using third-party tools, which usually come with a price tag, Google has also rolled out a Price Competitiveness Report for Google Merchant Center, allowing sellers to compare the price of their products with that of other brands selling the same product.
Set up price drop alerts to track changes in product prices, so that when they drop, you can ensure your pricing remains competitive.
How often do you monitor your competition?
Monitor your Google Shopping competition regularly. It doesn’t have to be every day, however on a weekly and monthly basis is a good idea. Remember to keep an eye on seasonal changes and competitor campaigns during large promotions and holidays as well.
2: Prioritize Google Shopping tracking
Your Google Shopping ads tracking needs to be rock solid and many advertisers want to know how to check if Google Shopping tracking is working. Check tracking and monitor it on a regular basis to ensure it’s set up correctly and recording sales and revenue accurately.
Accurate Google Shopping tracking is fundamental for knowing exactly how your campaigns are performing and being able to justify ad spend. It’ll then enable you (as well as Google Ads) to optimize your campaigns when using smart bidding strategies.
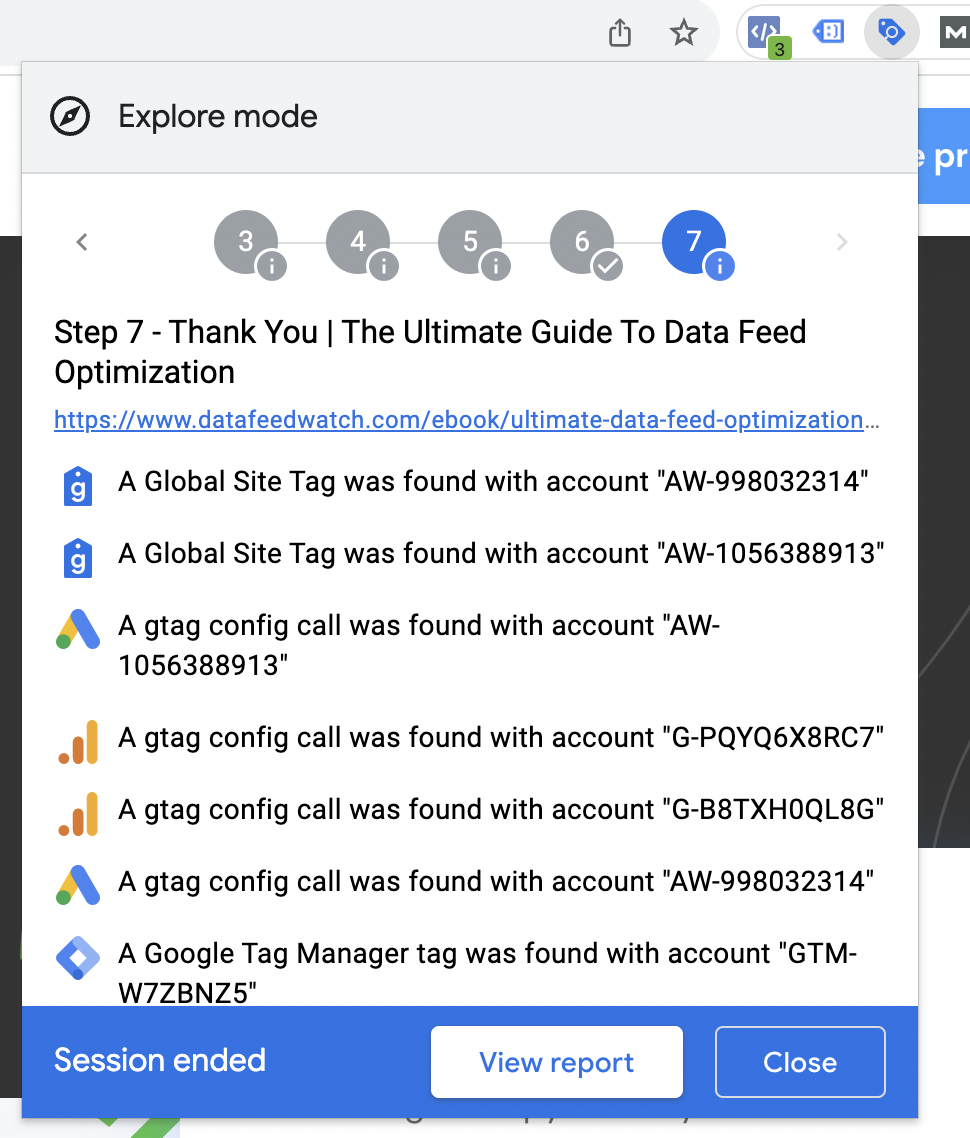
As a starting point, use the Google Chrome extension Tag Assistant for Conversions to check on all of the Google tags that are firing on the site, and when they fire. This tool enables you to troubleshoot any issues that need fixing and confirm it’s working.
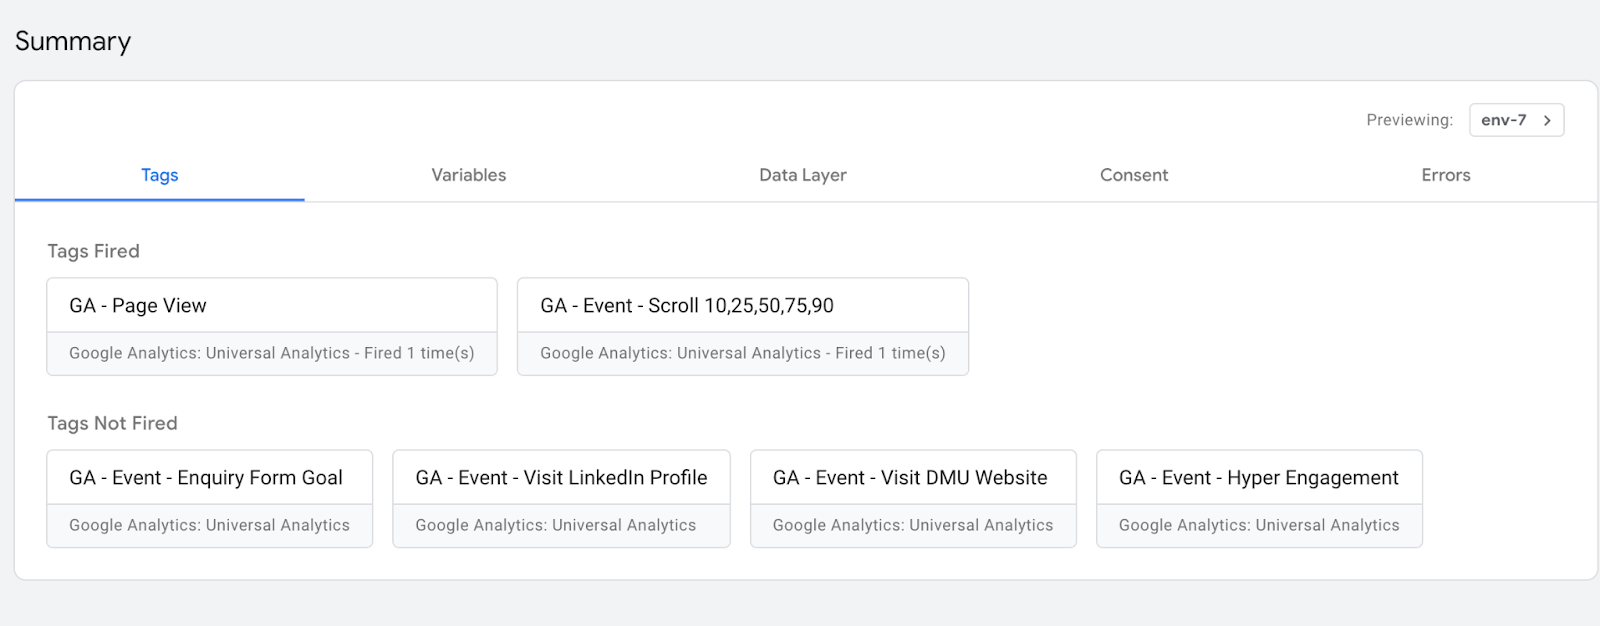
If you use Google Tag Manager, make sure you use the preview feature to determine when tags are firing and when they aren’t.
In your Analytics platform, cross reference conversion data such as purchases and revenue and ensure it matches your commerce platform. It is normal to see small discrepancies between different platforms, however, getting it as accurate as possible is the main goal.
In most instances, websites are not static. Dev work takes place on an ongoing basis and for e-commerce sites, new products are likely to be added all the time while existing products may be updated. Therefore staying close to tracking is important for the success of Google Shopping.
How does tracking work for Google local shopping?
For Local Google Shopping ads, Google hosted local shop fronts via ValueTrack are no longer supported, meaning tracking templates will no longer be usable. This includes third-party tracking for conversions or clicks. However, clicks to Final URLs will continue to be trackable by third-party ad trackers.
3: Monitor key performance metrics
Once you are happy tracking is accurate and the data in your account and reports matches that in your e-commerce platform, the next thing to monitor is metrics.
Here is a table of key conversion metrics that should be monitored as often as possible, taking into account varying date ranges to get a true understanding of performance.
|
Conversions |
Conversions are the desired outcome of your target audience and for e-commerce, they are generally product purchases. Conversion could also represent phone calls, form submissions, brochure downloads and sample orders. |
|
Conversion value |
This metric represents the revenue generated from the conversions, such as the sale of products and services. |
|
Conversion rate (Conversions/clicks) |
Conversion rate is the average number of conversions per ad interaction, which is usually a click; however, it could also include other interactions such as video views. |
|
Cost per acquisition (CPA) (Cost/conversions) |
Google names this metric ‘cost per action’ and it represents the total amount of spend it took to receive the desired action by your customers. For example, if the cost was £100 and this generated two purchase conversions, CPA would equal £50. |
|
Return on ad spend (ROAS) (Conversion value/spend) |
Return on ad spend measures how much revenue has been generated in relation to how much was spent on advertising. If an advertiser spends $100 and generates $500 in revenue, the ROAS would equal 5 or 500%. |
|
Average order value (AOV) (Conversion value/conversions) |
Average order value is the average amount of conversion value or revenue that your products generate. For example, if one product generated $250 and another generated $40, AOV from these sales would be $145. |
For e-commerce, monitoring each and every one of these metrics on a daily, weekly and monthly basis is paramount to understanding performance, profitability and for optimization purposes. To make sure you're tracking all conversion data accurately use the Google Analytics reporting tool.
Determine your break-even point and then what your target CPA and ROAS metrics should be in order to be sustainable and profitable. Aim to improve conversion rate and AOV to improve overall profitability.
4: Start including profit-margin-based metrics
Level up the way you monitor Google Shopping ads also by tracking profit-margin-based metrics.
Profit-margin-based metrics will help to improve the performance of your Google Shopping campaigns by going deeper. It’s about understanding the relationship between individual products and their profit margin, in order to focus on the most profitable products.
Let’s say an accessories brand has a higher conversion rate for sunglasses over watches, advertisers may decide to optimize spend by moving the budget over to sunglasses, to increase the volume of sales. However, perhaps watches have a higher average order value (AOV) compared to sunglasses and therefore the fewer sales actually generate more revenue and a higher ROAS.
|
Product |
Cost |
Conversion Rate |
Sales |
AOV |
Revenue |
ROAS |
|---|---|---|---|---|---|---|
|
Sunglasses |
$25,000 |
5% |
125 |
$220 |
$27,500 |
1.1 |
|
Watches |
$25,000 |
3% |
75 |
$800 |
$60,000 |
2.4 |
This scenario represents a good foundation for advertisers to optimize campaigns, however, it doesn’t take into account the profit-margin of watches VS sunglasses.
Profit-margin-based tracking is about identifying the margin and using it to further improve optimization and performance. To do this, the cost of goods sold (COGS) should be monitored.
Track the cost of goods sold (COGS) and use shopping cart data
Cost of goods sold (COGS), also referred to as cost of sales, can be calculated by taking away all costs associated with a product from the revenue it generates. By taking away COGS from conversion value, marketers are left with profit and profit margin.
Using the previous example, if a watch costs $500 to manufacture, package and ship, and sunglasses cost $22, the profit margin on sunglasses would actually be a lot higher, generating more profit even though sunglasses revenue is less than half.
|
Product |
Conversions |
COGS |
Total COGS |
Profit Margin |
Profit |
|---|---|---|---|---|---|
|
Sunglasses |
125 |
$22 |
$2,750 |
90% |
$24,750 |
|
Watches |
75 |
$500 |
$37,500 |
38% |
$22,500 |
With this level of data advertisers can then optimize their Google Shopping campaigns for profit, rather than CPA and ROAS.
Add COGS to Google Merchant Centre
It’s possible to pass COGS to the Merchant Center in your data feed for Google Shopping, by either adding it manually or by using automation.
To add COGS to your Merchant Centre account, add item id [id] and cost of goods sold [cost_of_goods_sold] into two individual columns in a spreadsheet (Google Sheets works well for this) and then import this data as a supplemental feed into the Merchant Center.
This then unlocks the conversions with basket data extension, showing you the exact items that are purchased following a user clicks on an ad, as well as things like top-selling items and profit generated.
It also allows advertisers to understand cross-sell patterns and identify products that have a higher AOV and lead to a higher cart value.
Base account structure on profitability
Structure your account and campaigns around individual product profitability, and inventory status and then segment campaigns so that you are able to prioritize ad spend by profitability.
- Product profitability
Analyze the cost of goods sold (COGS) by taking into account things like staff overheads, production, packaging, shipping, etc.
COGS can then be added to products as a custom label, enabling you to segment your products based on profitability.
Finally, build a priority scale for inventory segments, such as high, medium and low.
- Campaign segmentation
Next, it’s important to segment your Shopping / PMax campaigns based on product profitability and inventory status. This will enable you to tailor bid strategies and spend for each segment.
For example, you could build a campaign for high-margin and high inventory status and then increase spend for this segment and similarly exclude low-margin or low priority products.
This would be an effective starting point for taking into account product profitability, however, it’s not perfect. The downsides are not being able to see the individual products that were bought and the difficulty in seeing the gross profit of a campaign.
Set up custom margin tracking
The most technical option is to implement custom margin tracking, which involves either setting up your own custom tracking pixel or using a profitability tracking tool.
Setting up your own custom tracking pixel is the most advanced option and would require in-depth analytics and dev knowledge and work. Whereas using a profitability tracking tool is slightly less complex and is likely the most suitable option for the majority of advertisers.
Read a success story detailing how a web design business was able to increase Google Shopping profit by organizing products by price and profit margin using custom labels.
5: Use automation for competitive advantage
Take competitive analysis one step further by using automation for Google Shopping price monitoring. Manually monitoring competitors takes up a lot of time and it can easily slip off the radar.
Conclusion
Google Shopping is a really effective channel for driving online sales and revenue, however, you get out what you put in. Putting these 5 Google Shopping monitoring strategies into practice will ensure you get the most out of your campaign.
Adopt an active approach to campaign management and monitoring to ensure no stone goes unturned, keeping optimization consistent.
Another way to boost your Google Shopping performance is to focus on the components of your shopping ads and aim to improve them. Here are 10 ad elements and how to improve them for better results.